An approachable campaign aesthetic for Twilio’s nonprofit division
Following the success of their 2022 State of Consumer Experience Report, the Twilio team entrusted Highwire with the UX and visual design of their 2022 State of Nonprofit Digital Experience report campaign.
Twilio sought to expand upon the visual direction established in the previous report with a softer, more approachable look-and-feel that better reflected their nonprofit division, Twilio.org. Collaborating closely with Twilio stakeholders, I set the creative direction, led UX design, and oversaw design production across an integrated digital campaign that spanned web, document design, and social.
Art direction
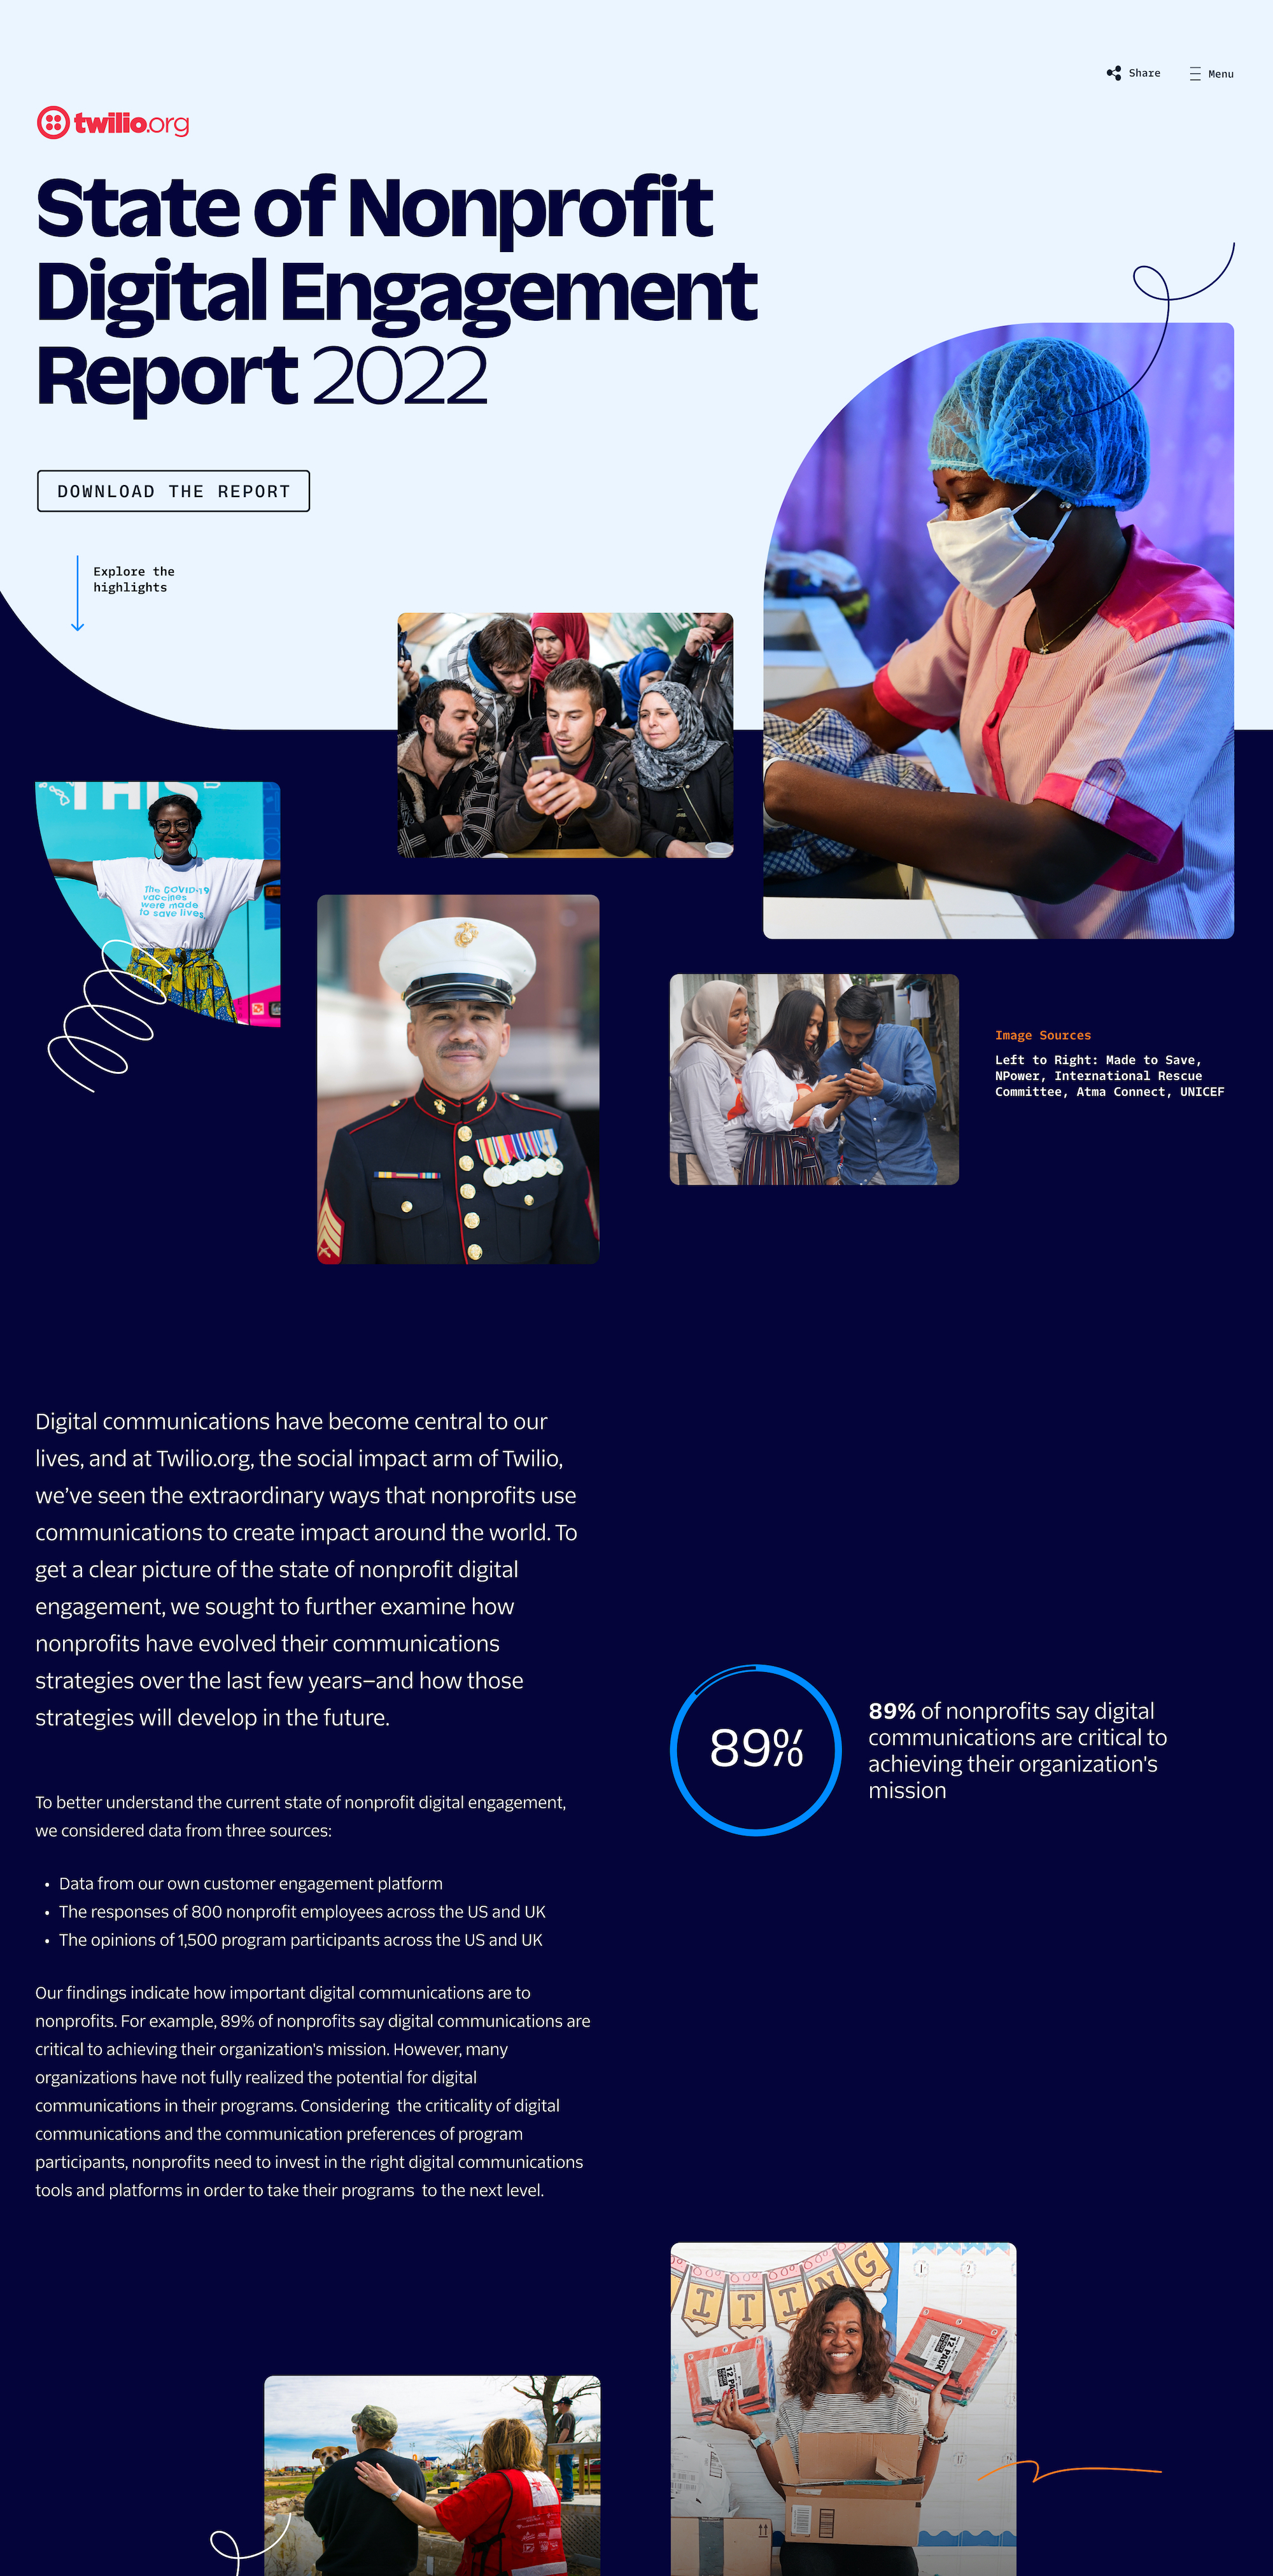
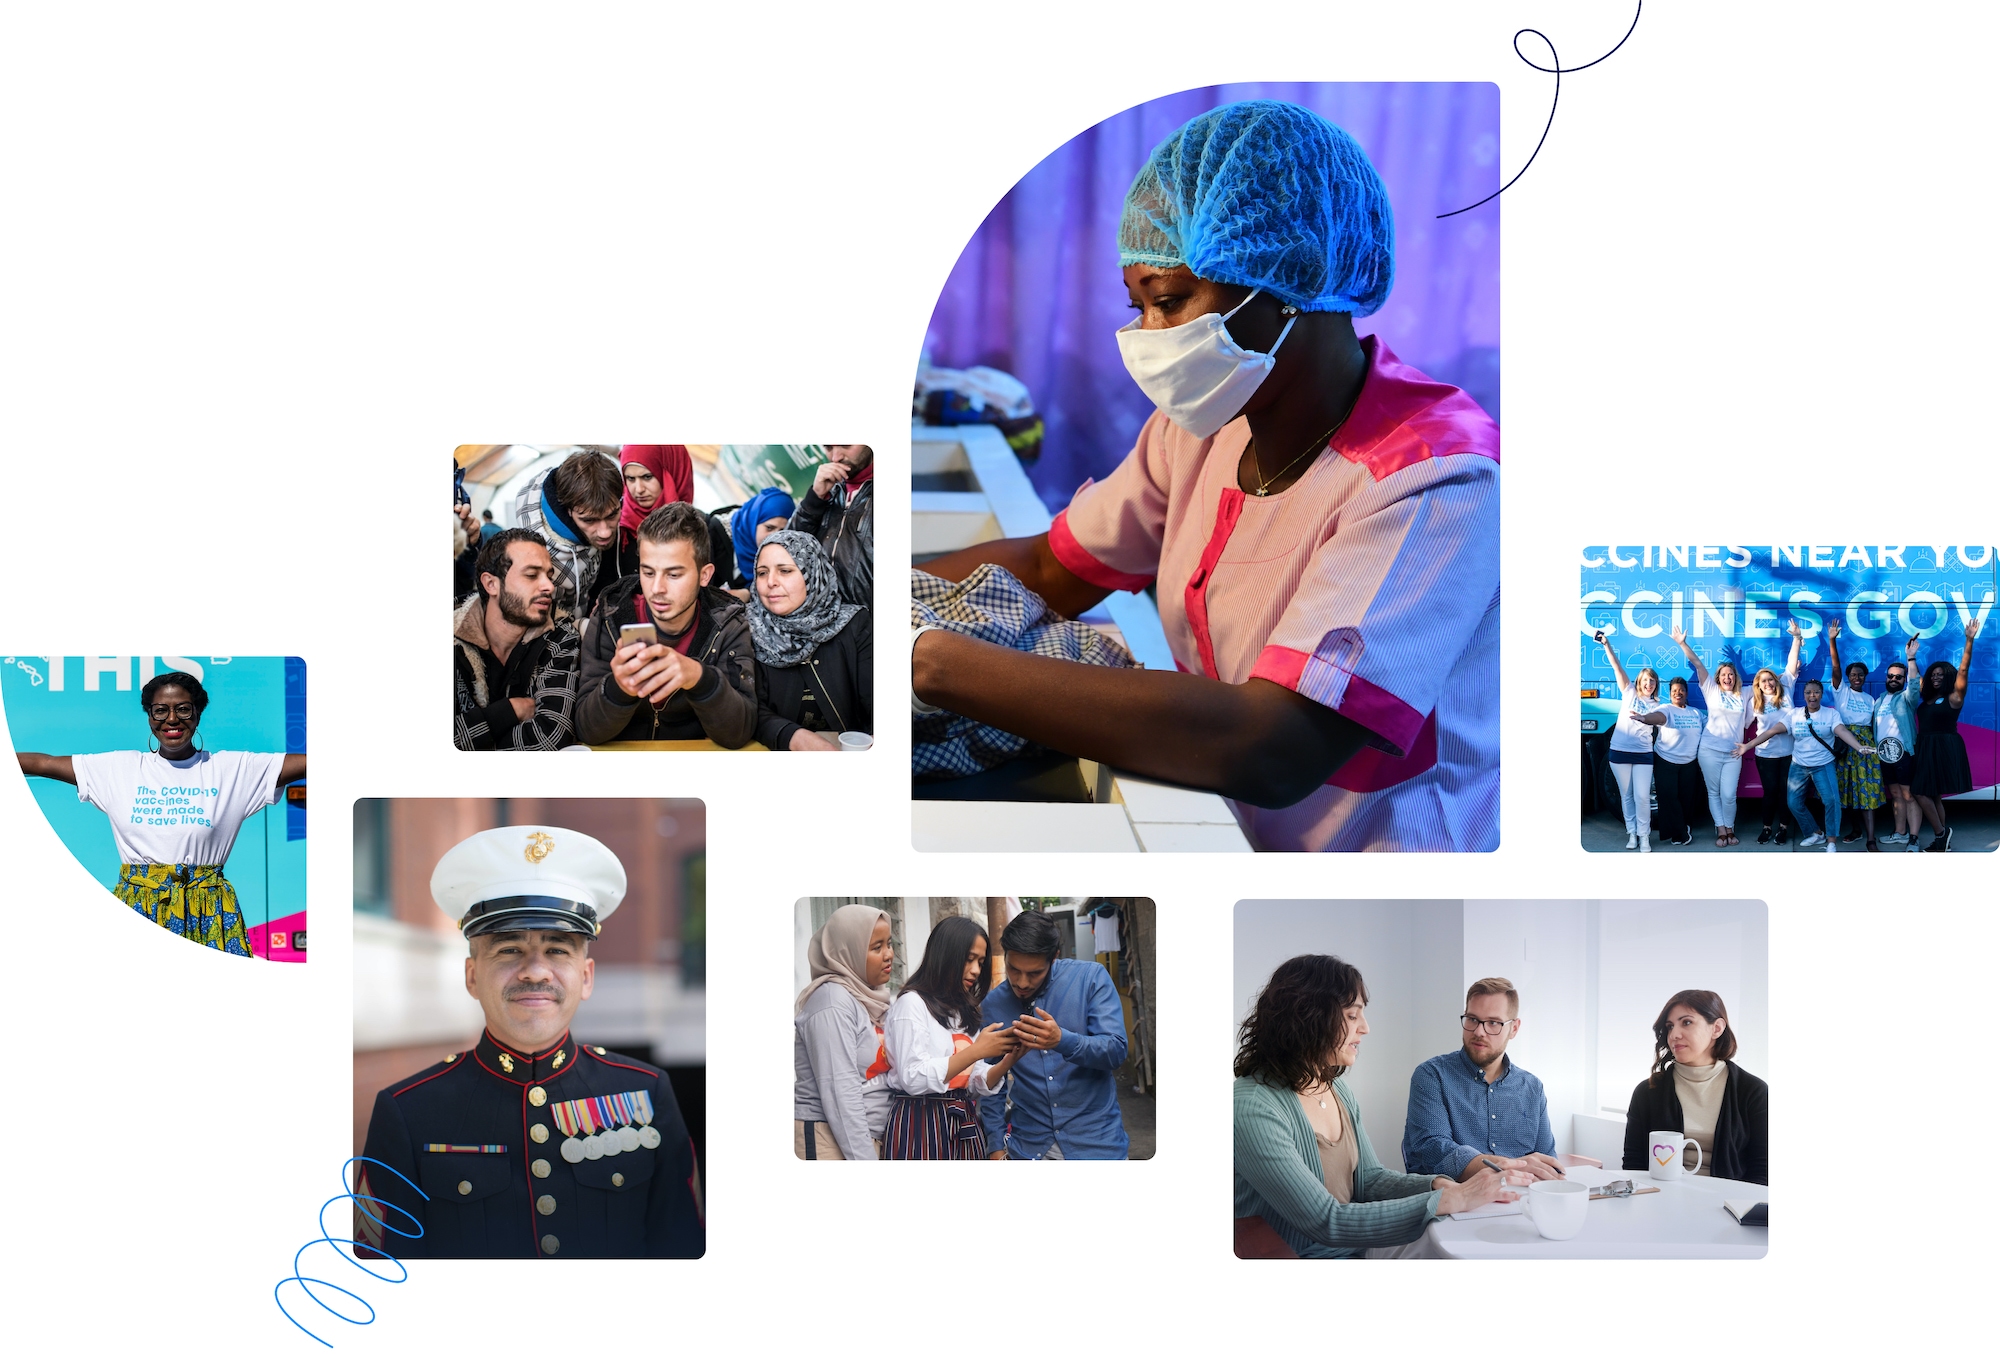
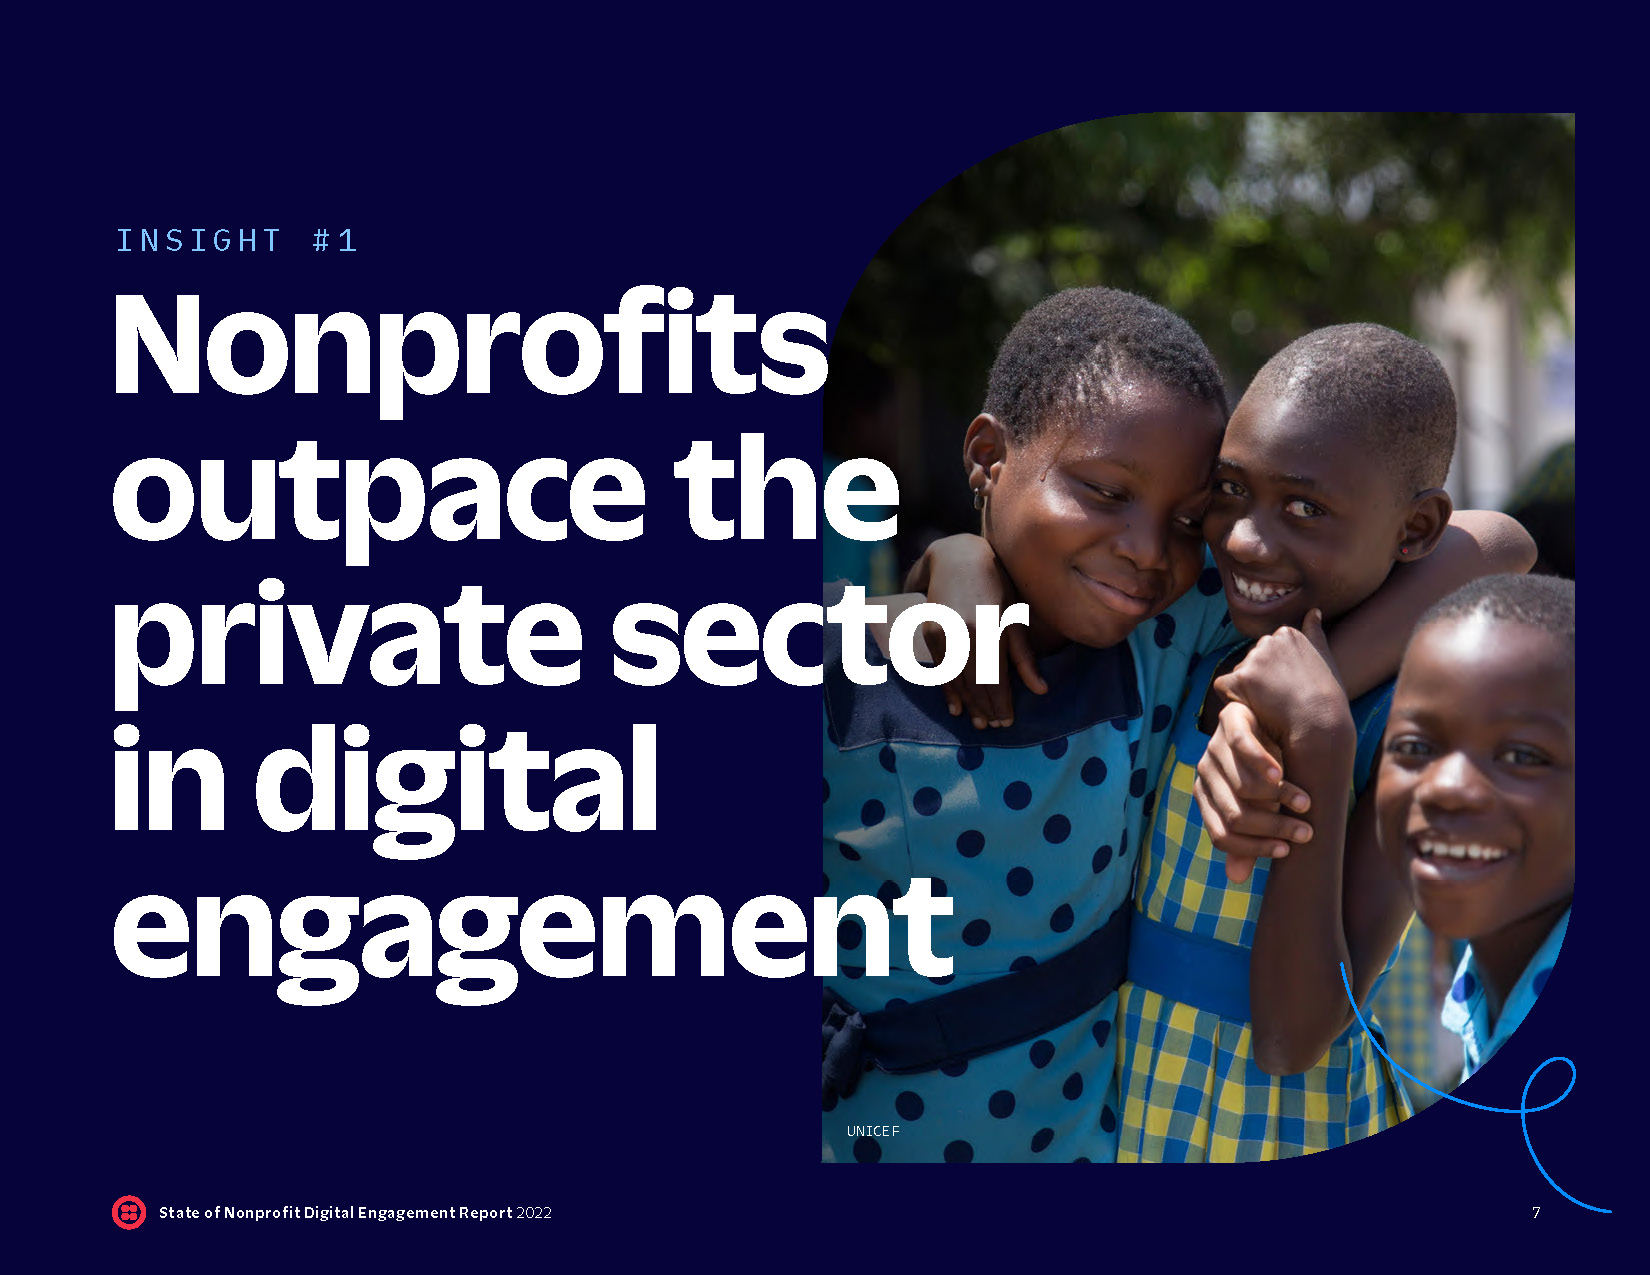
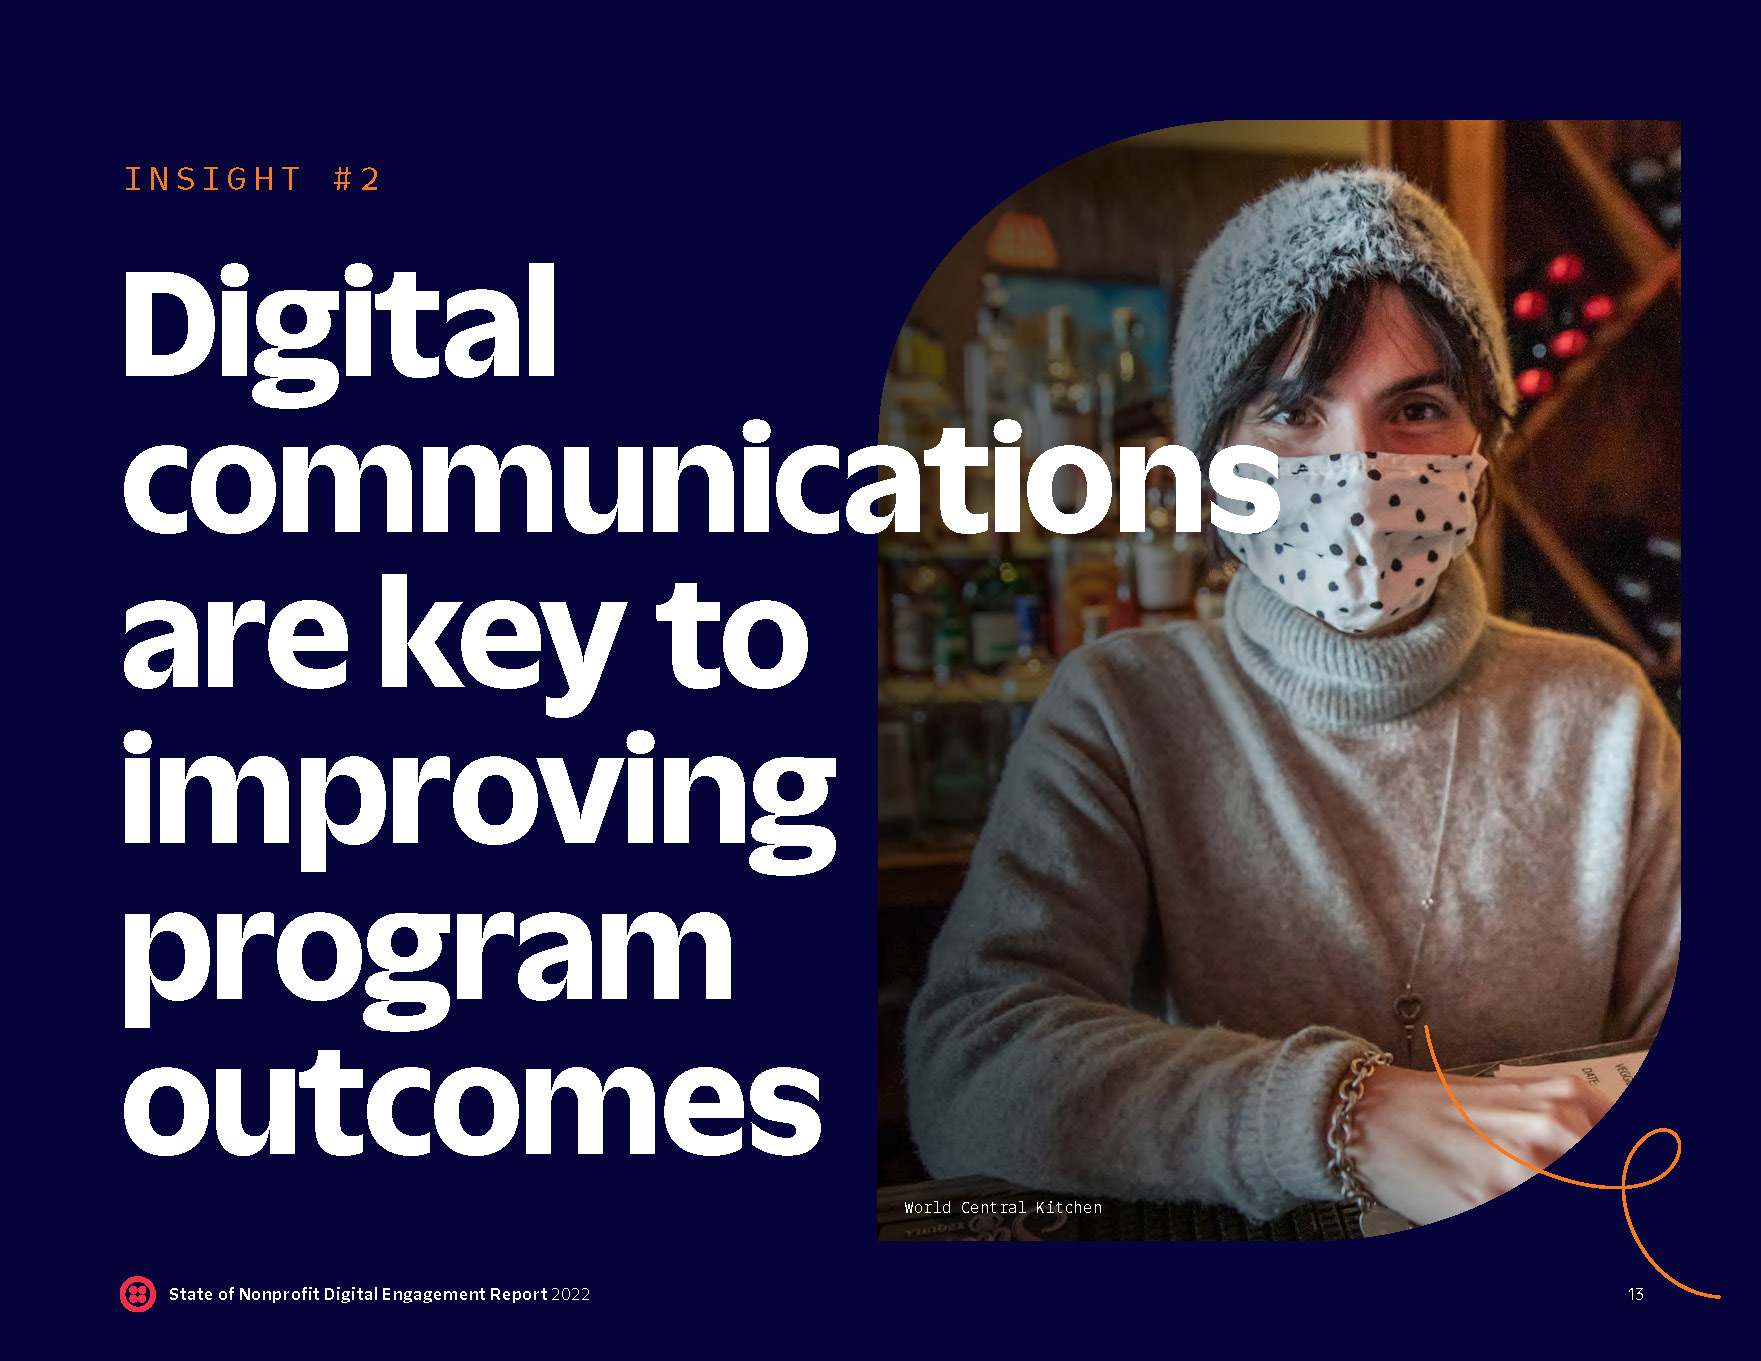
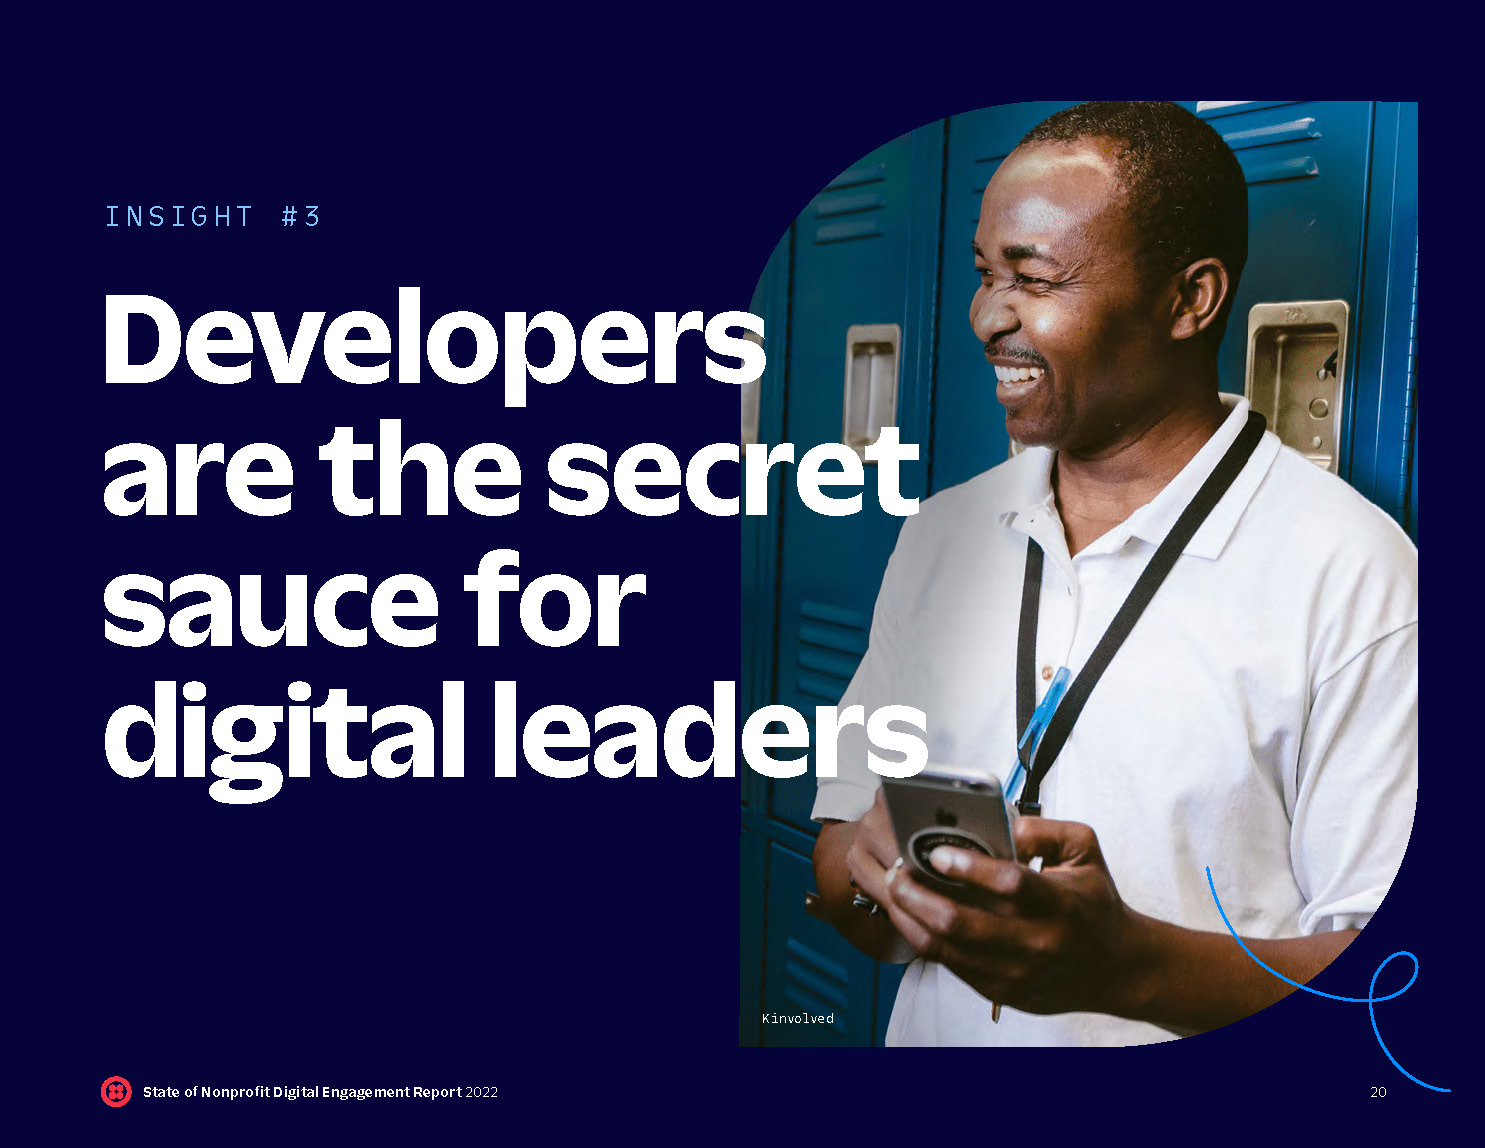
The campaign look-and-feel presents natural photography of the nonprofits served by twilio.org in scrapbook-inspired layouts. Rounded corners, organic squiggle shapes, and a bright yet professional color scheme help convey a sense of openness and approachability in tune with the organization’s social impact mission.
Report design
The 43-page report provides an overview of the issues and digital trends impacting the nonprofit world in 2022. We arrived at an alternating blue/orange color palette to better differentiate between the five report sections.
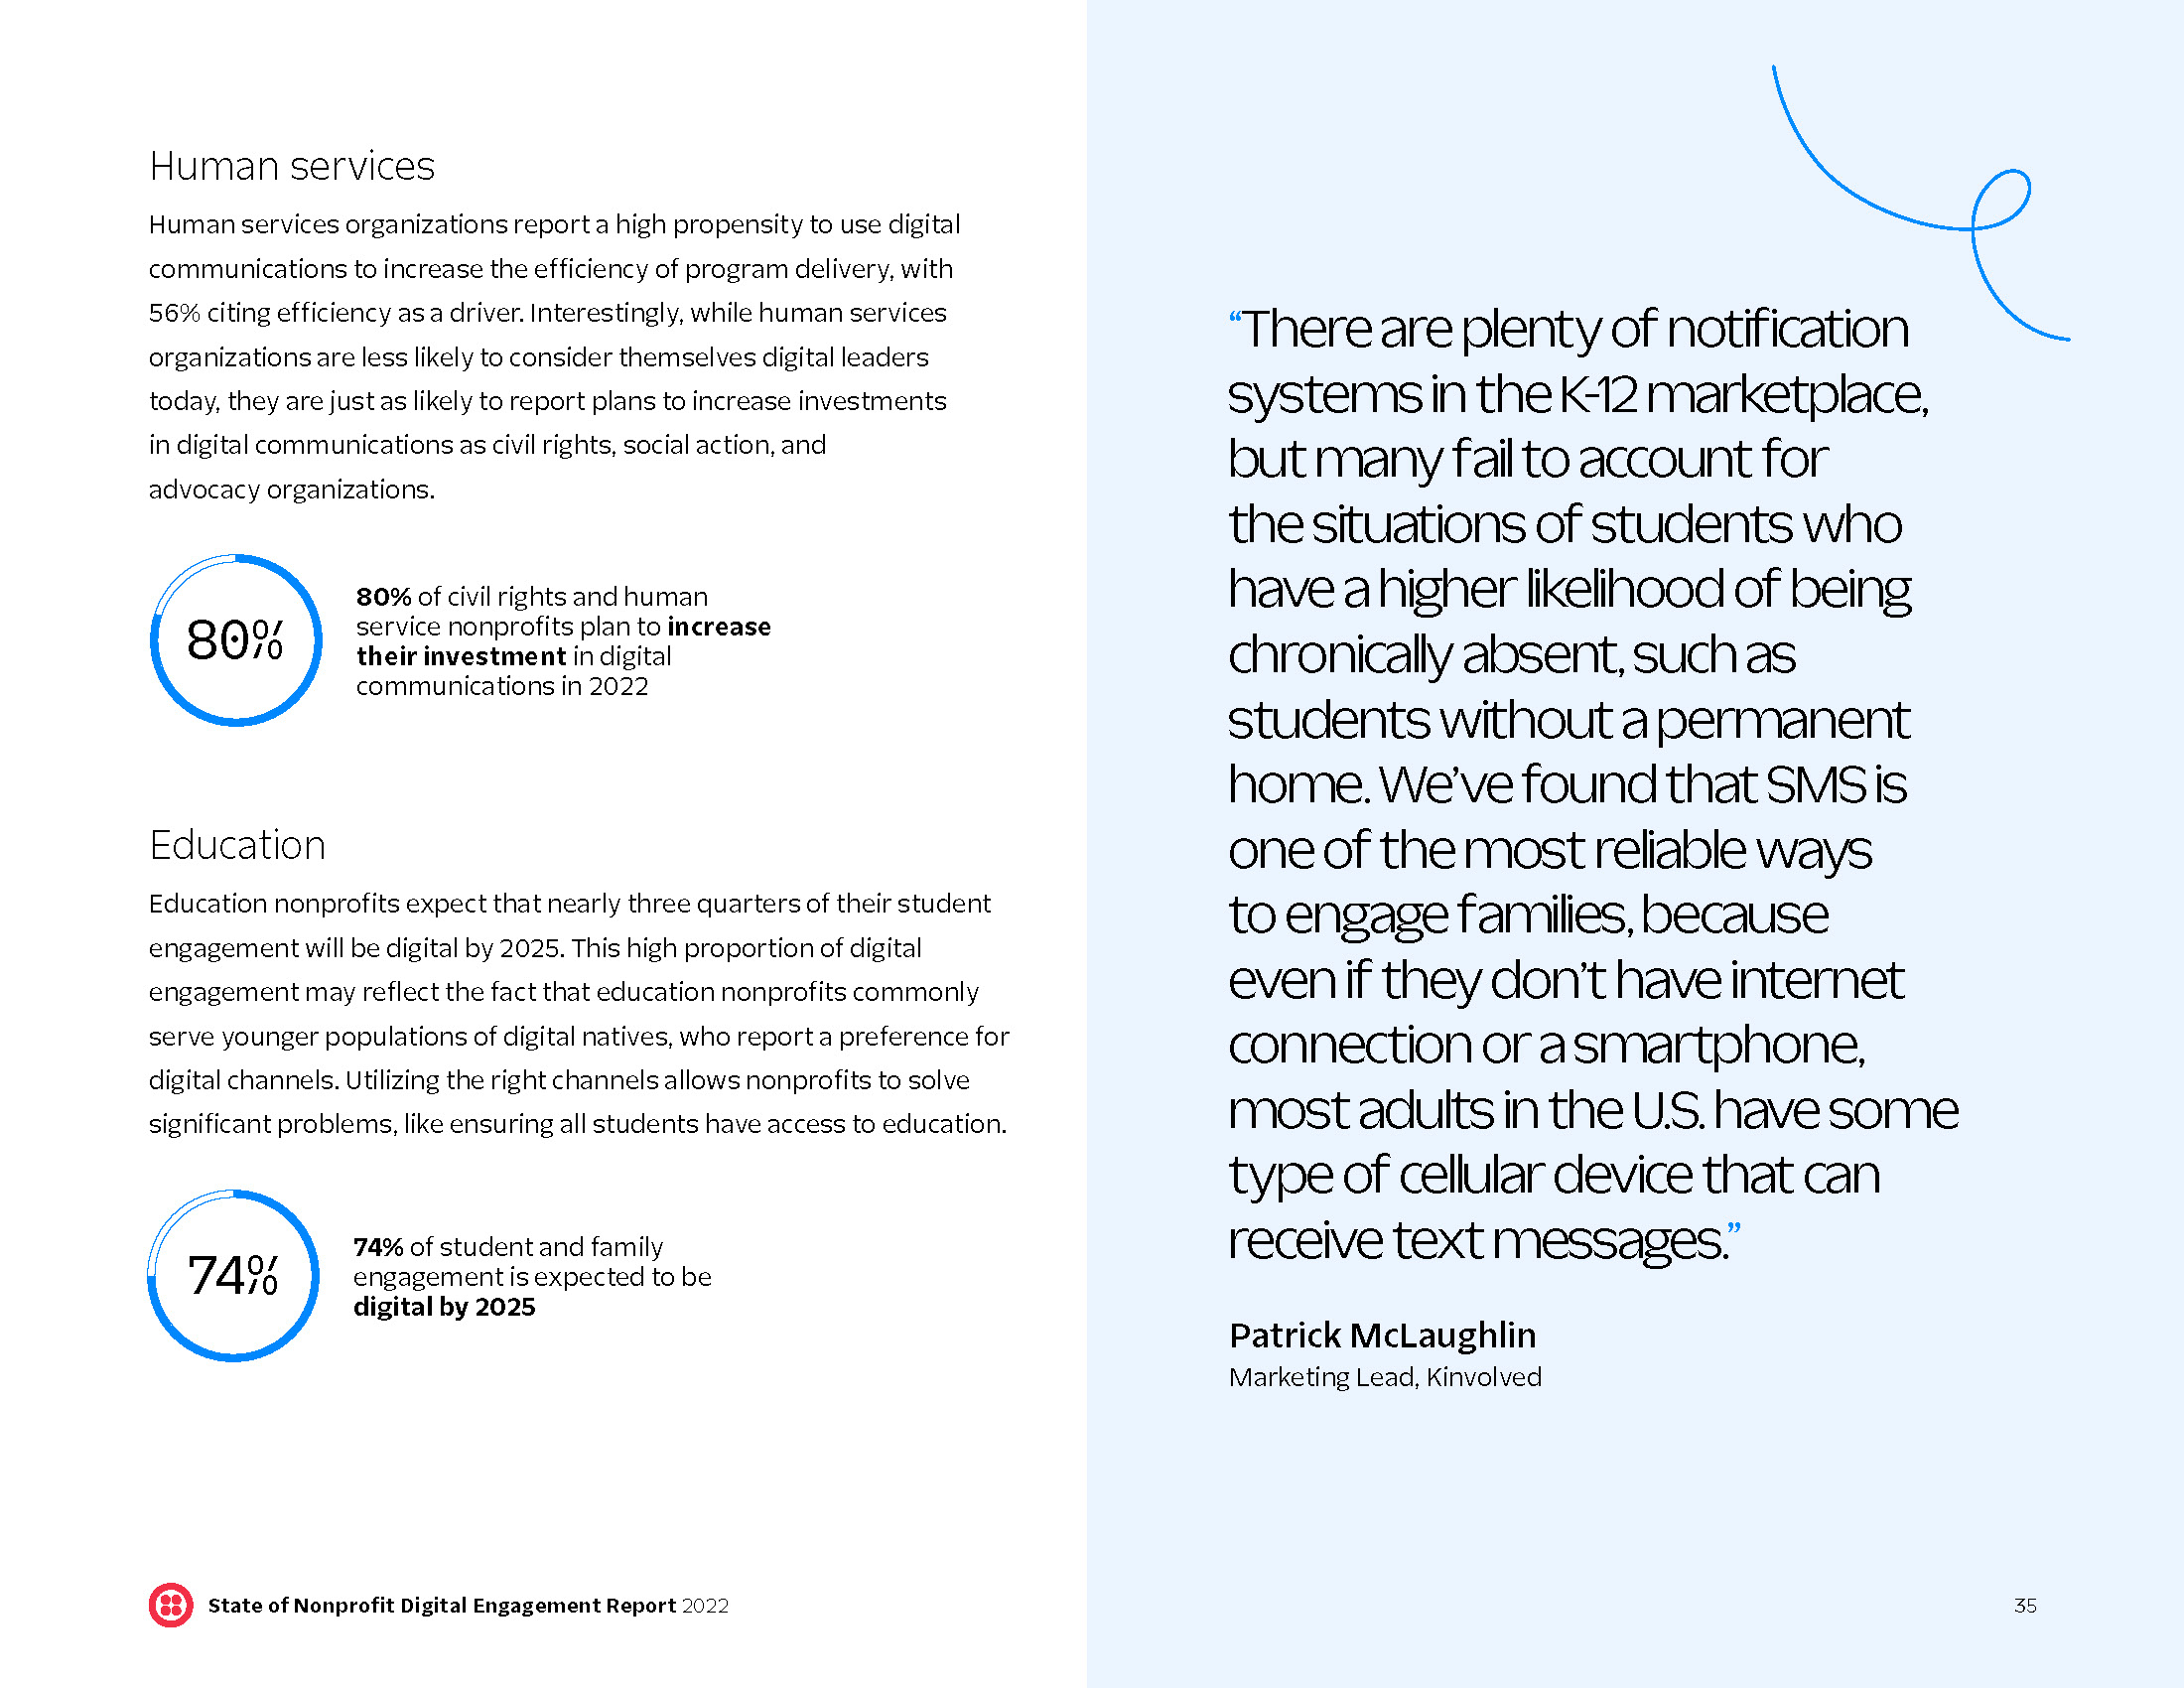
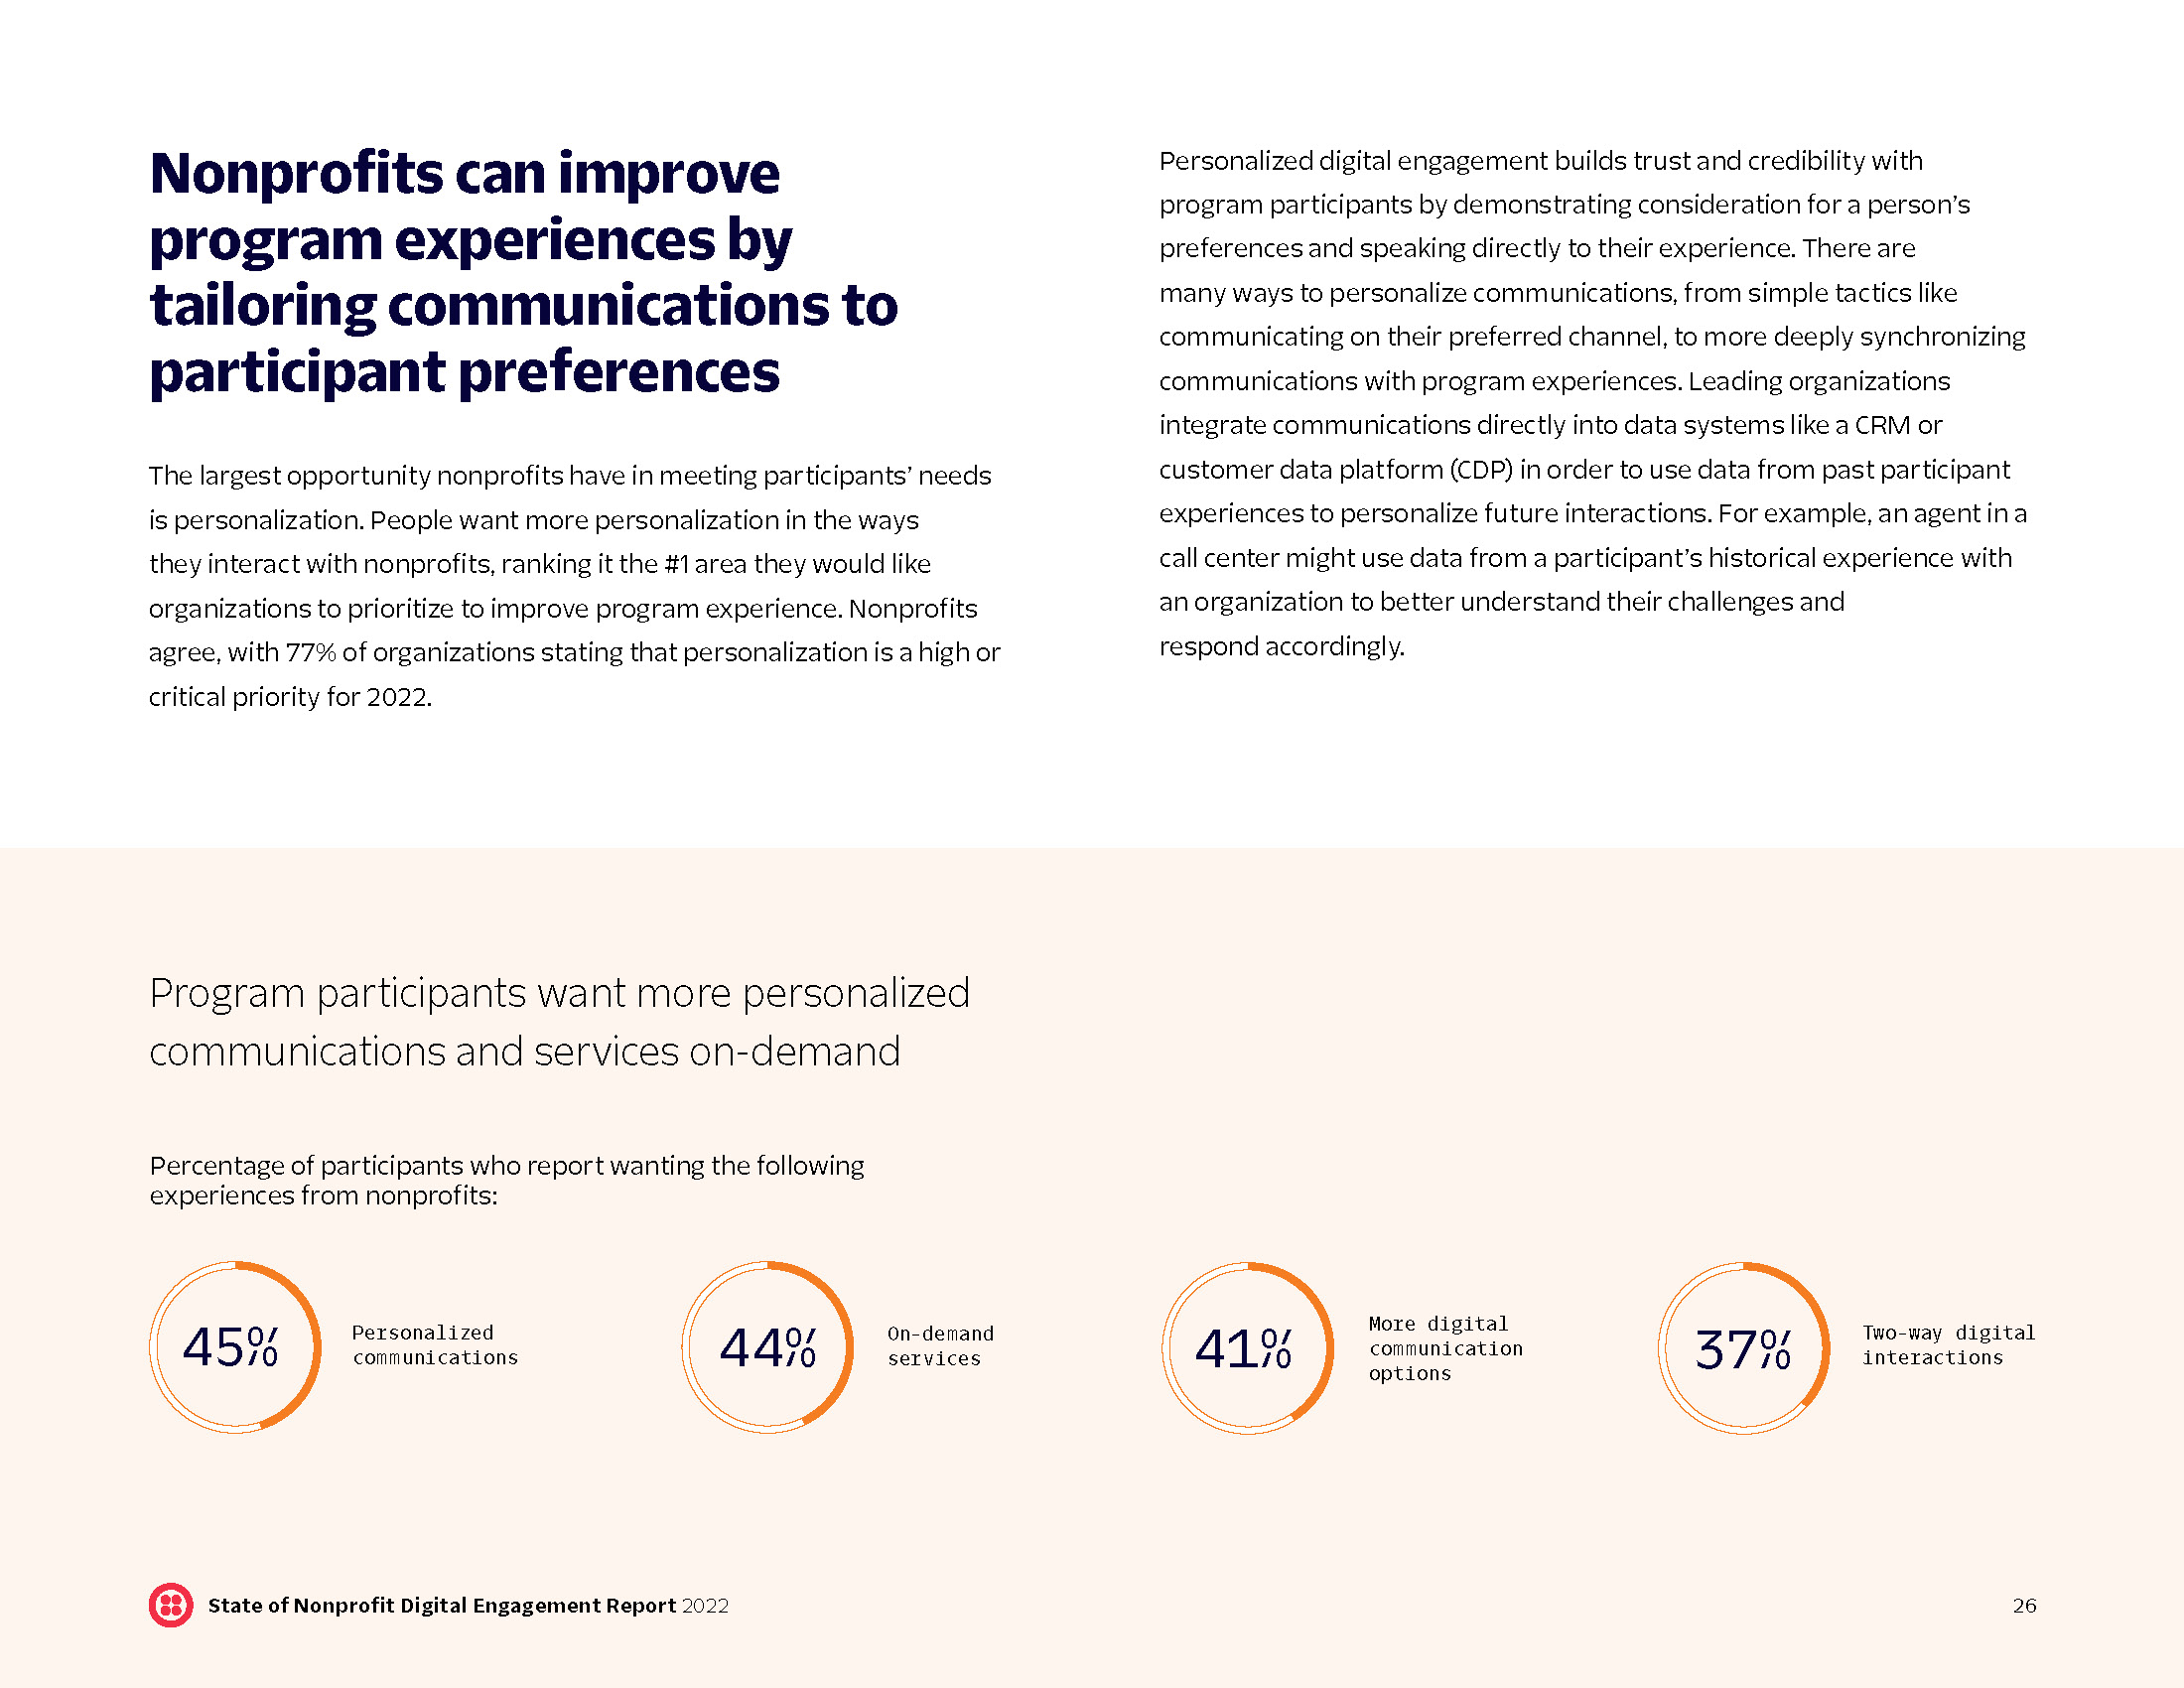
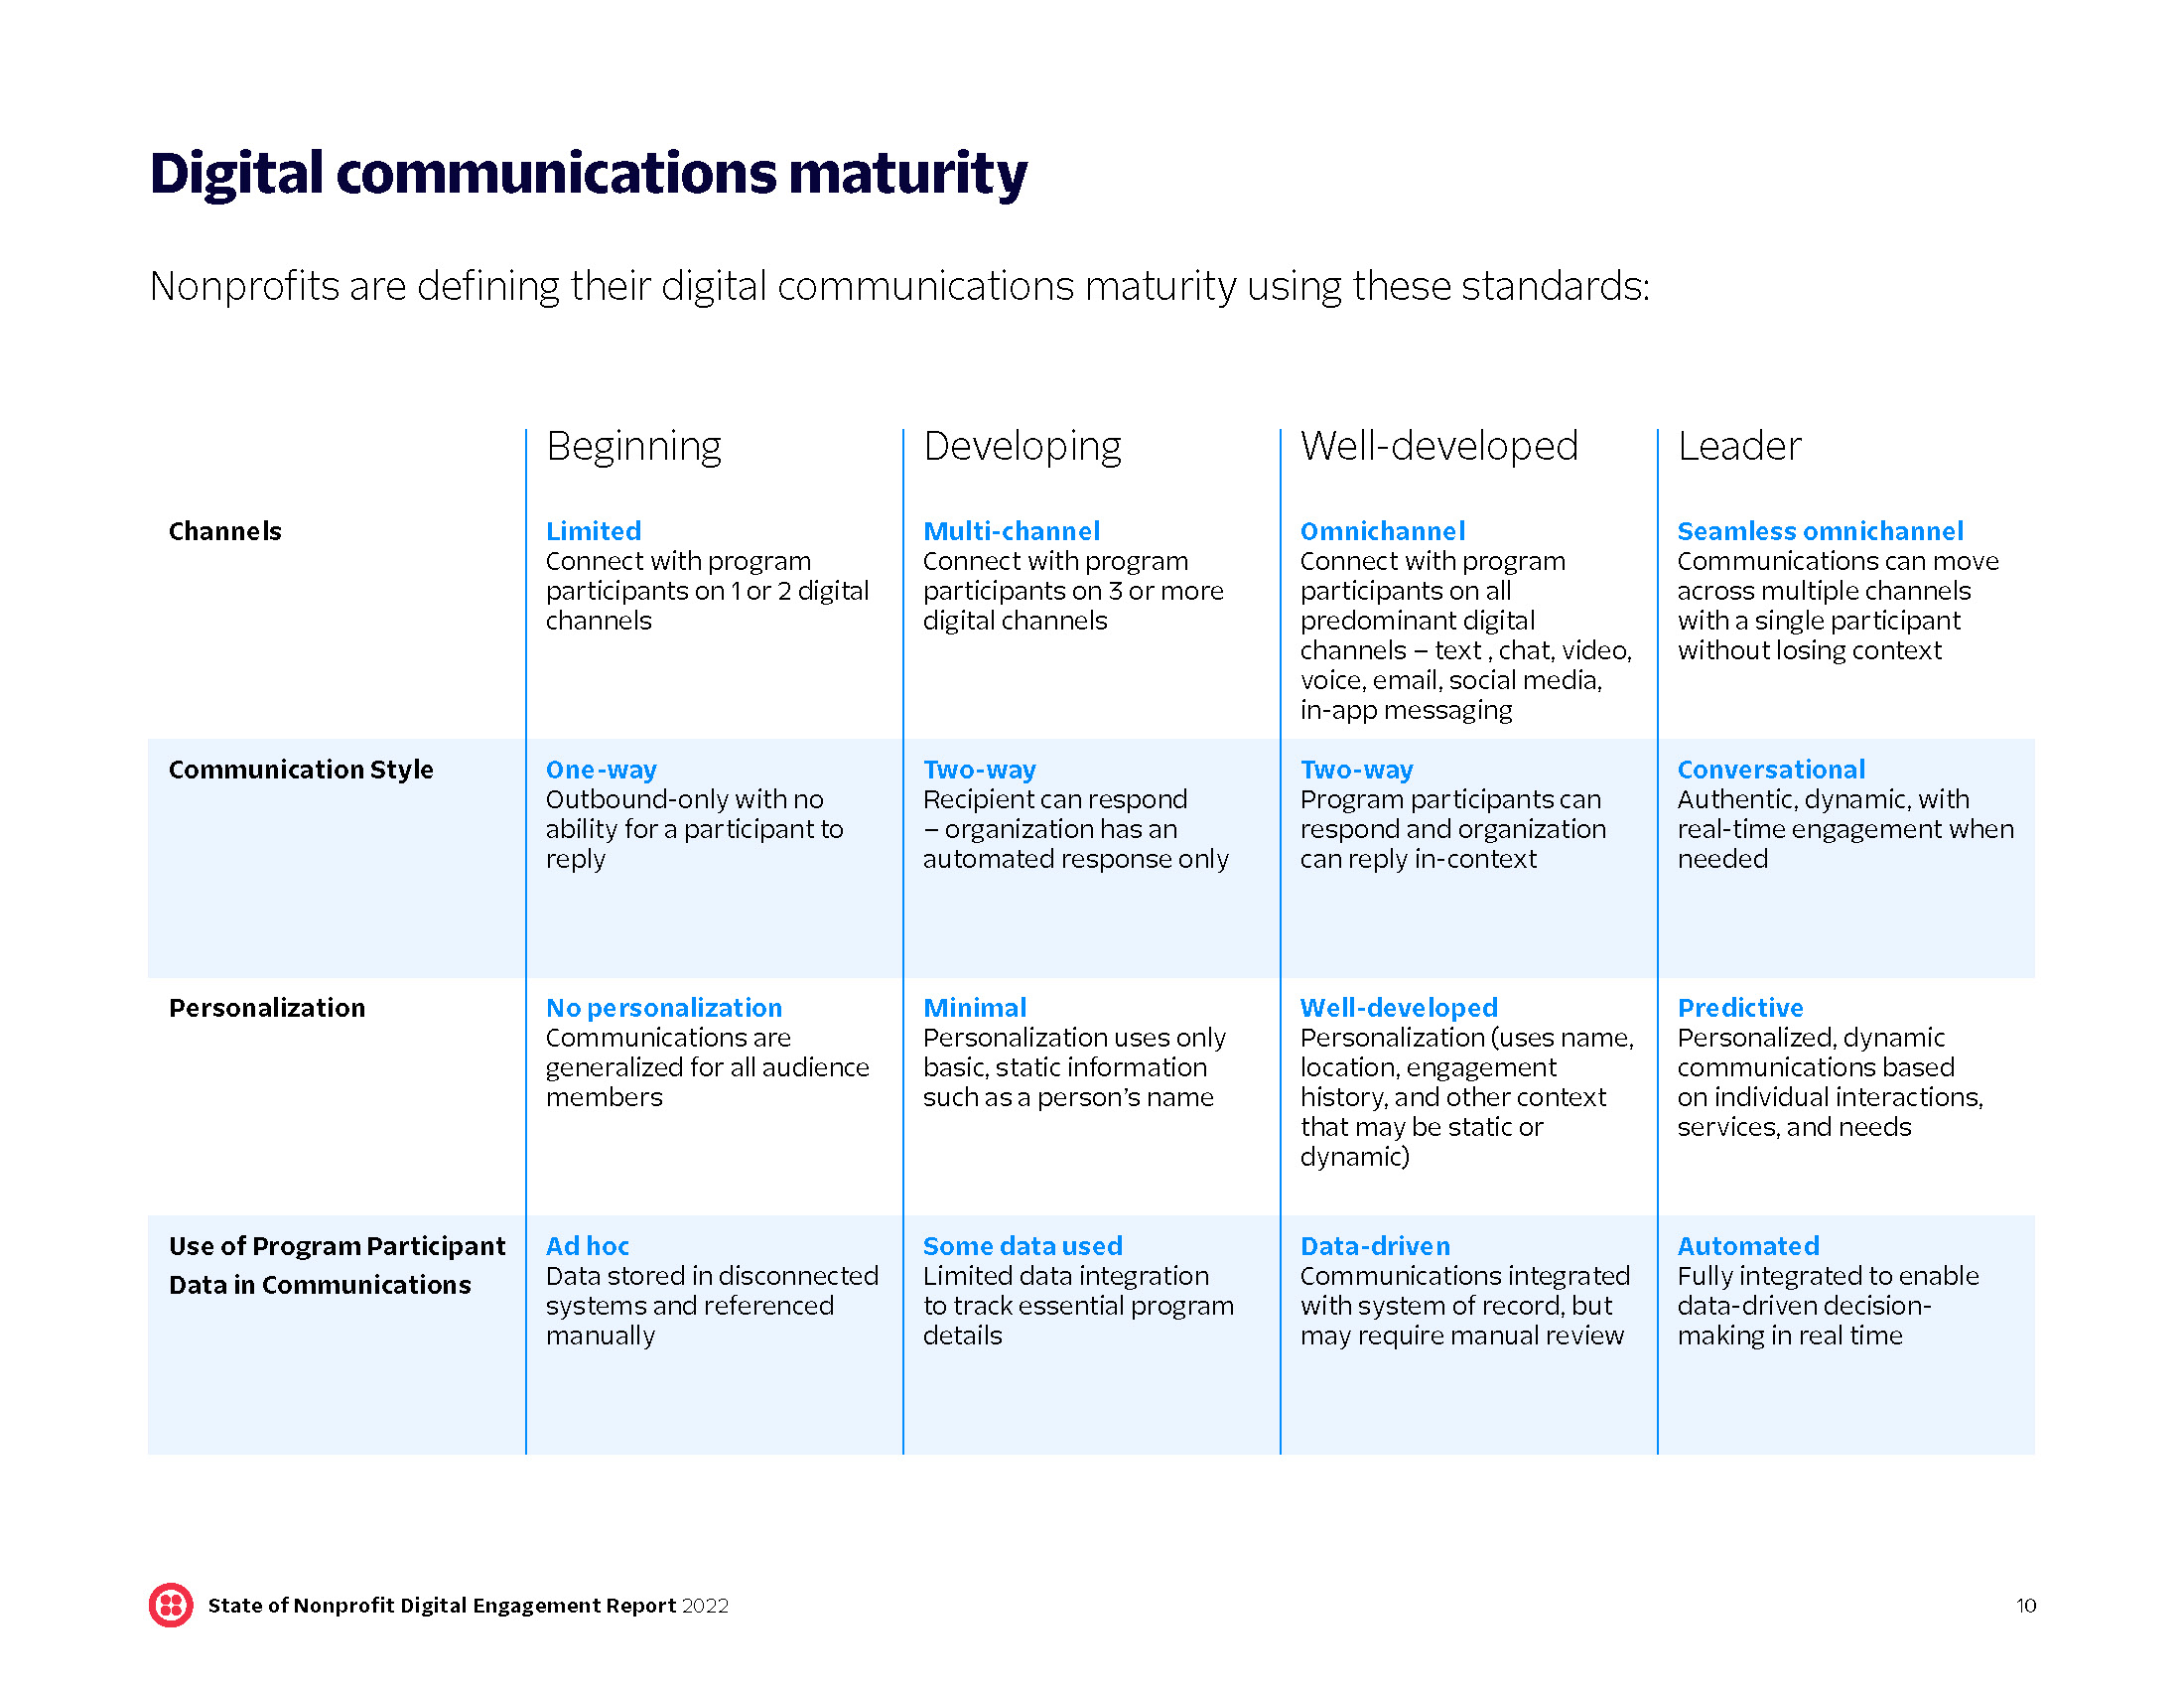
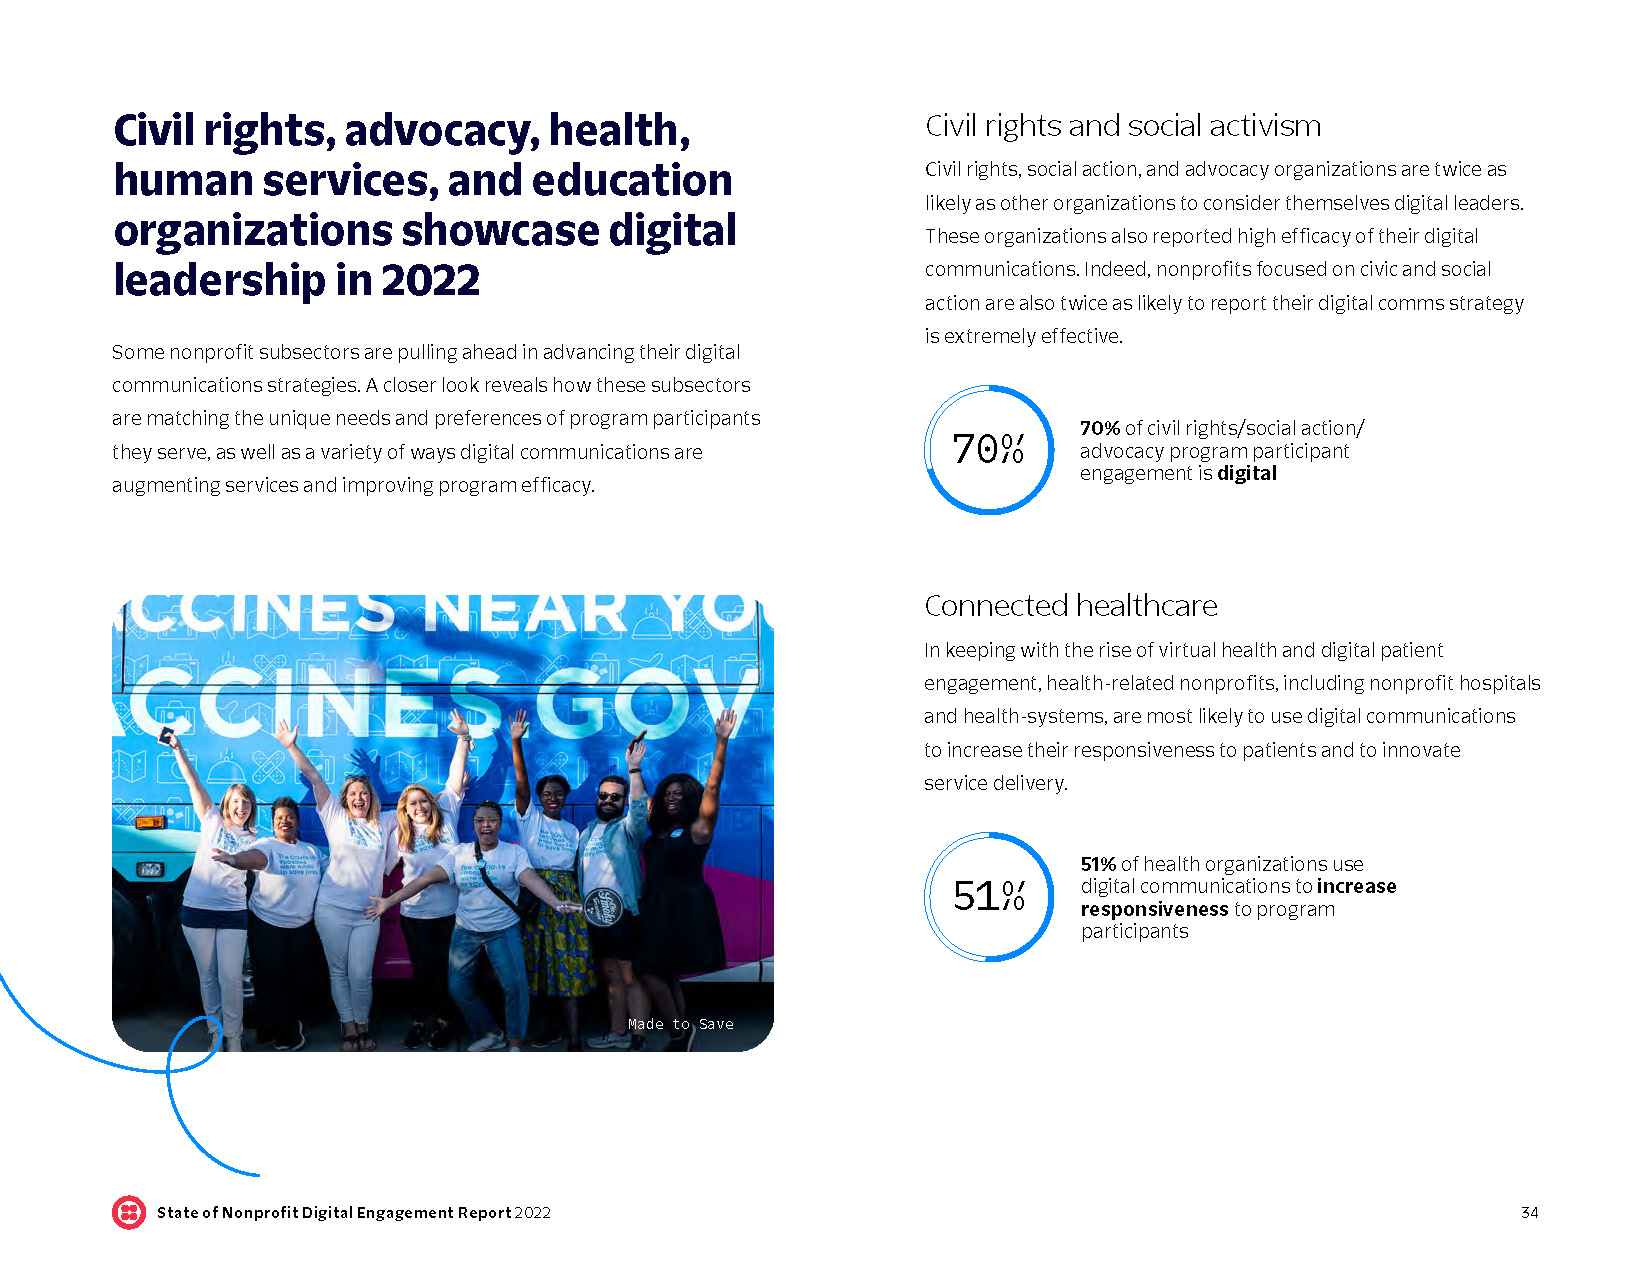
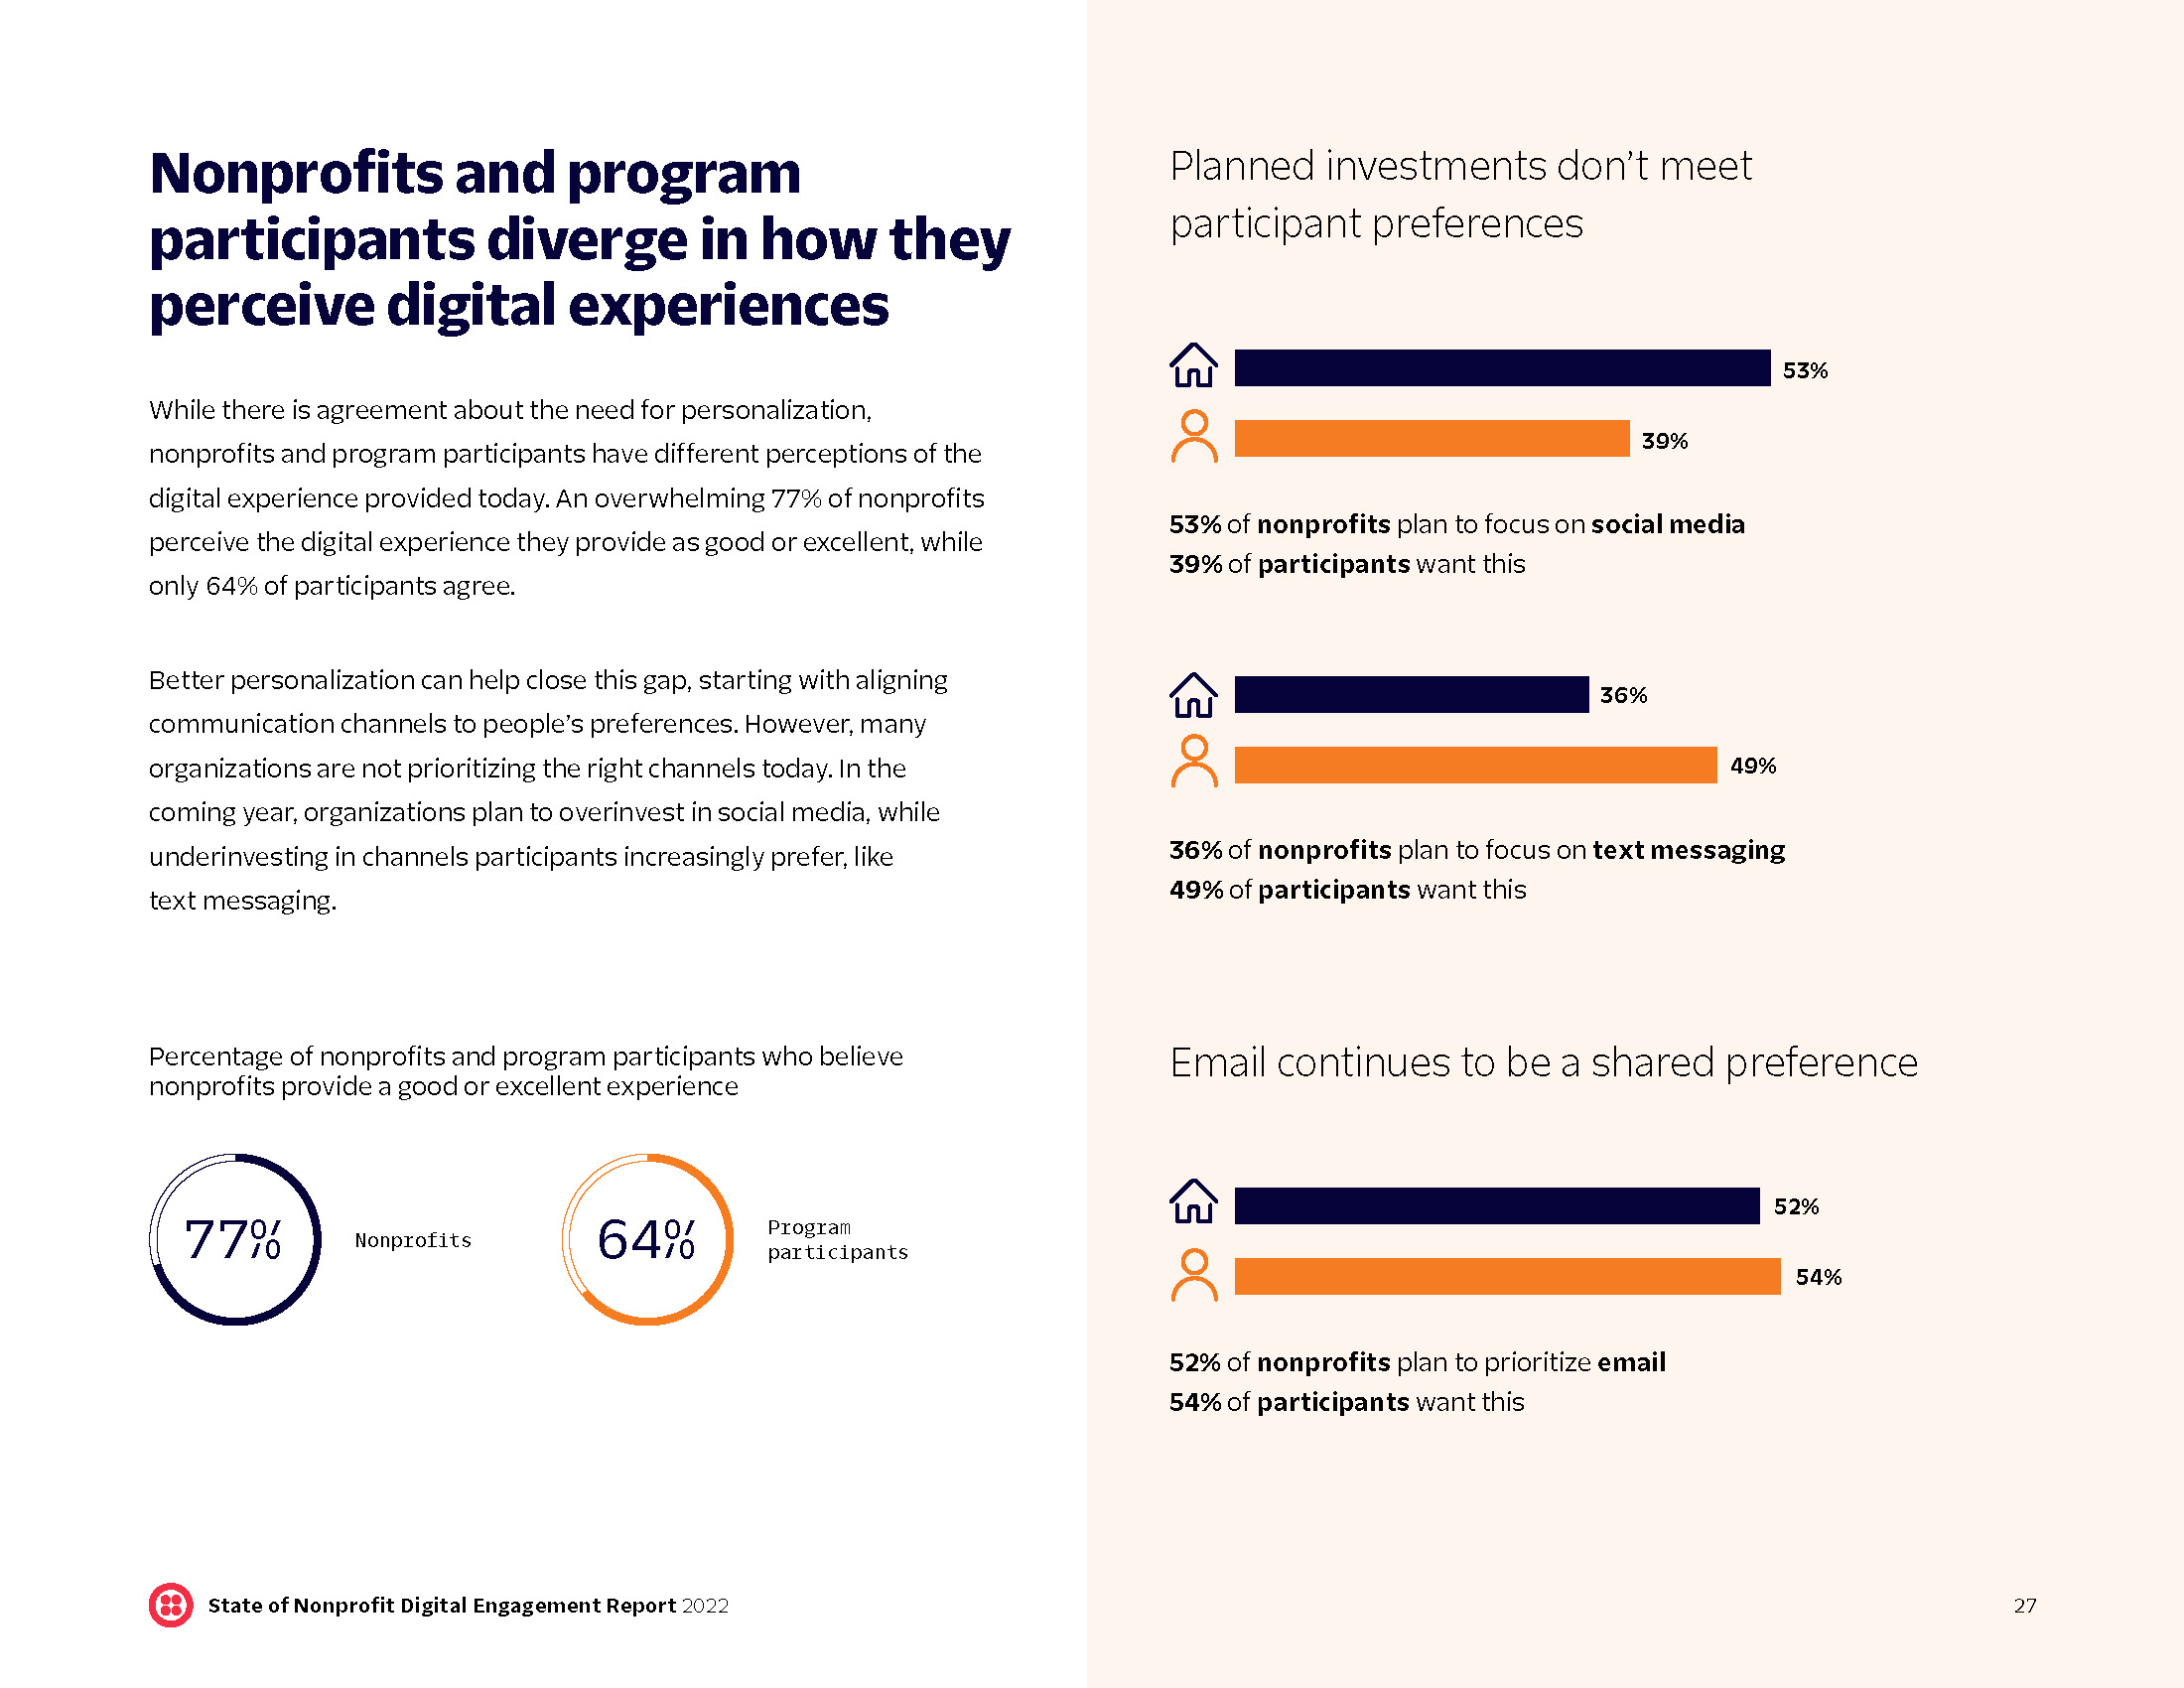
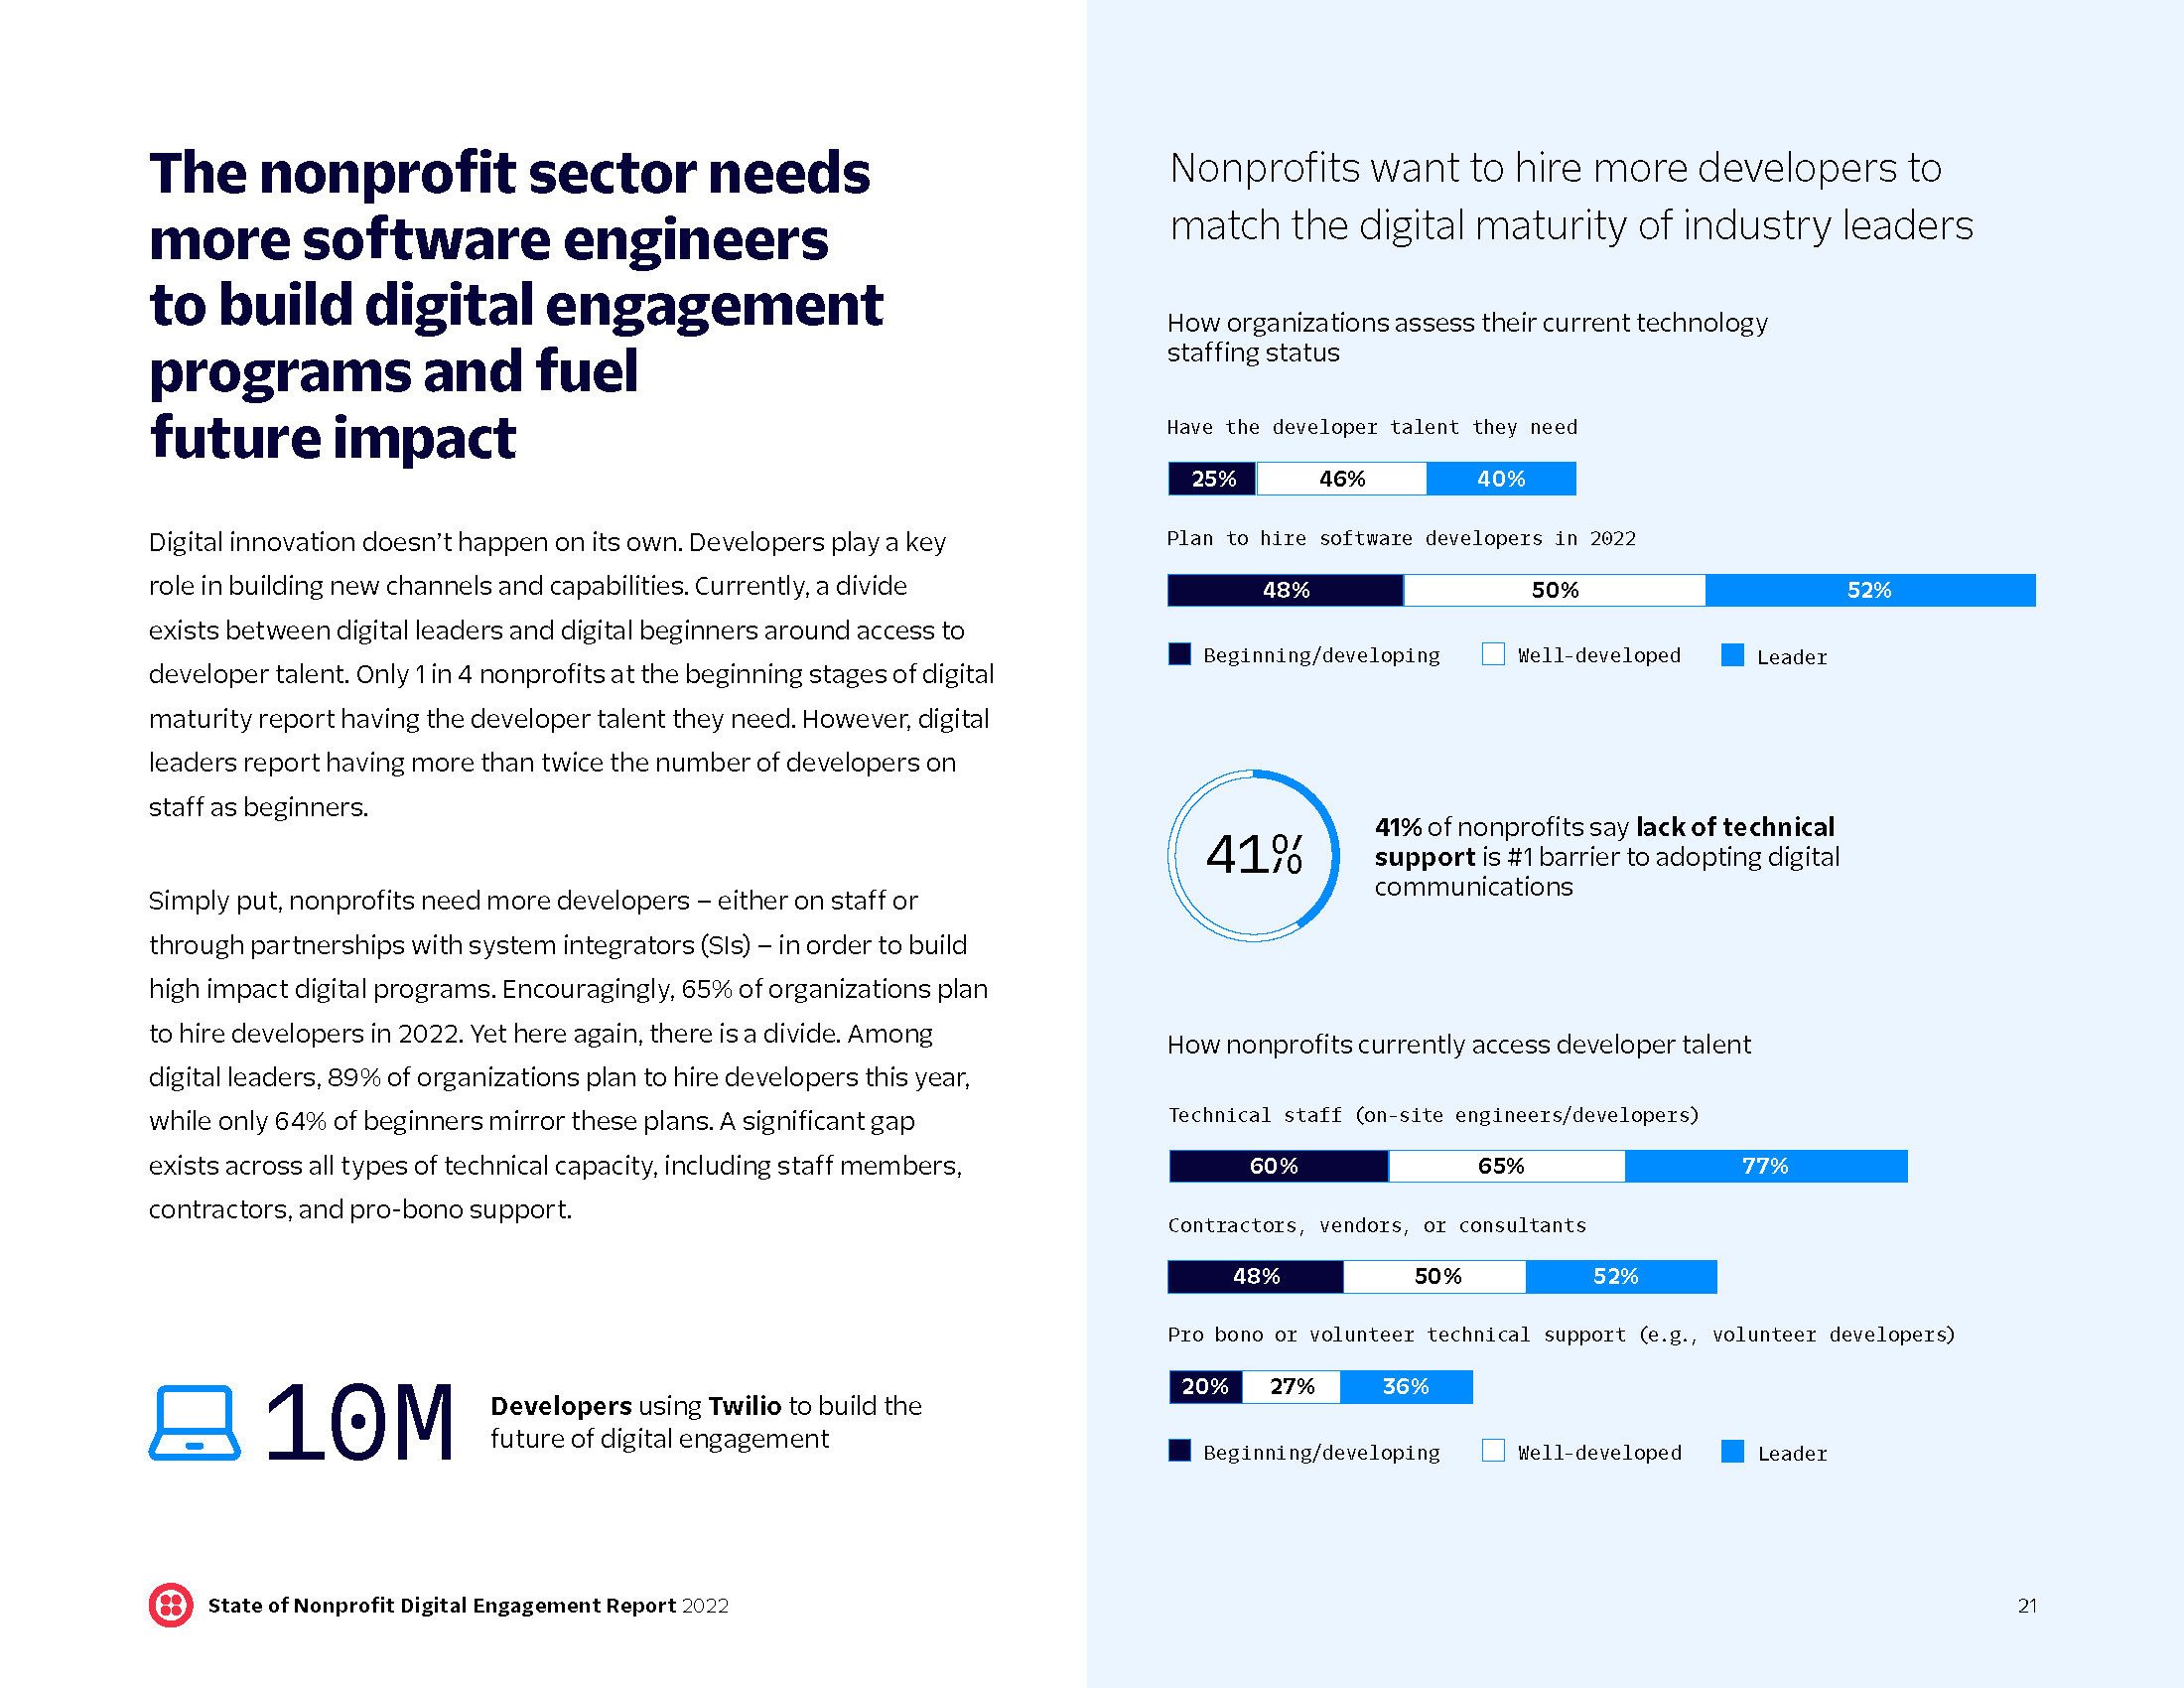
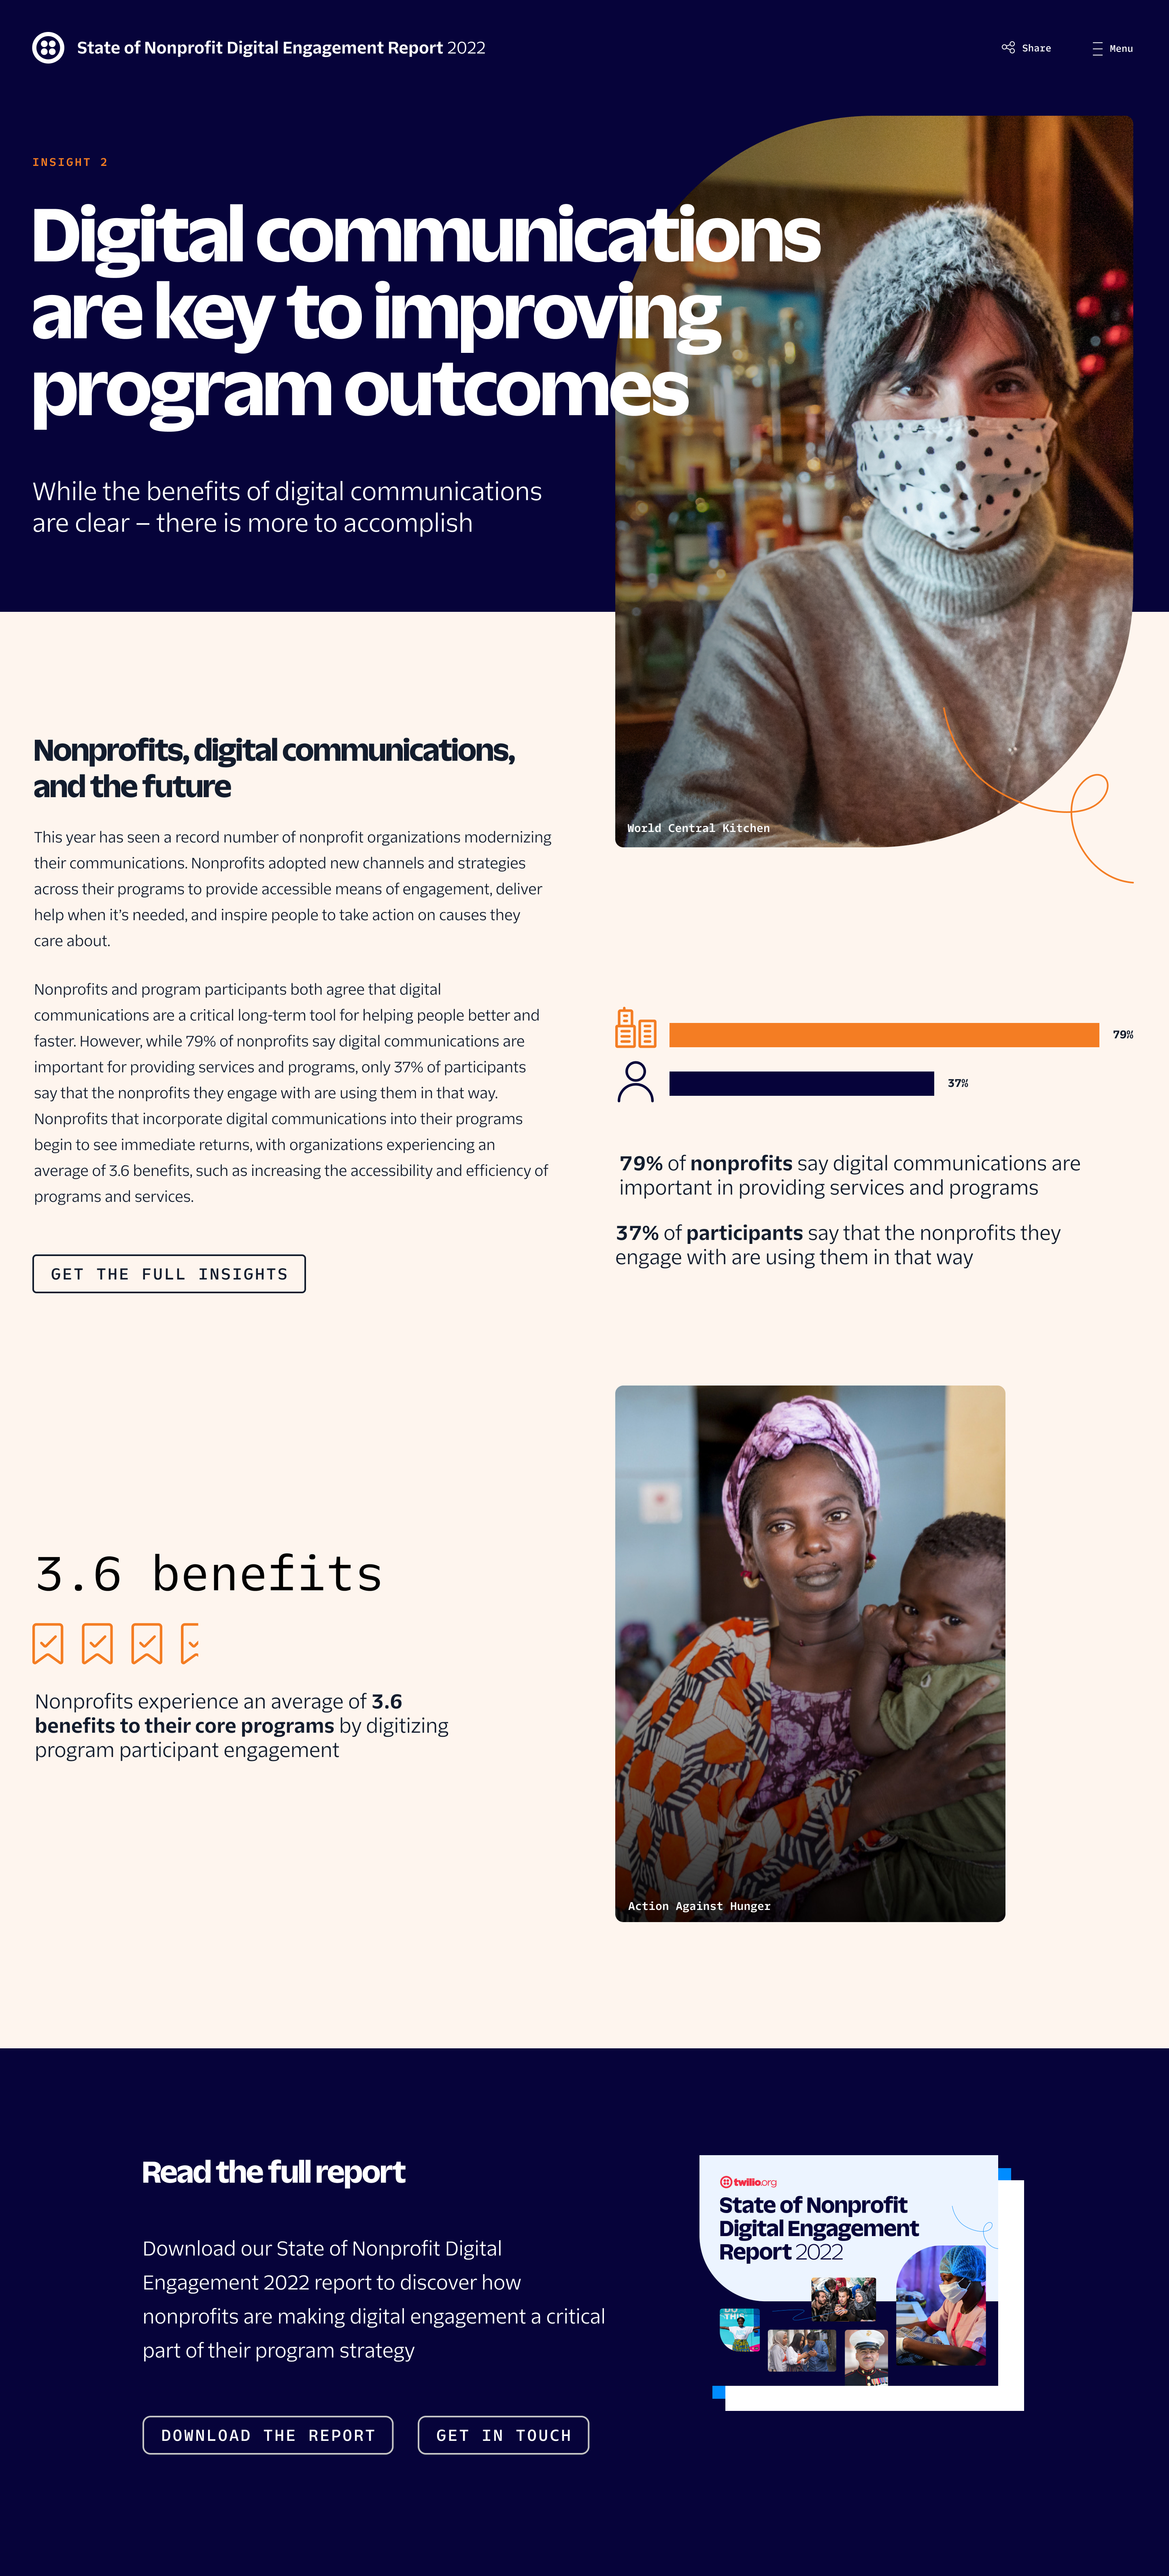
I collaborated closely with the editorial team on how best to visually represent complex data sets. Our final approach mixes color-coded bar charts, pie charts, and bold icon-based stat graphics to provide accessible data snapshots that are quick to scan and and easy to interpret.

User experience design
Drawing upon insights from previous Twilio campaign work, our top web report priority was to better curate what content belonged in the web experience versus in the full report pdf download. We needed to strike the right balance between peaking reader interest and driving report downloads, ensuring enough content was held back to encourage readers to fill out the lead generation form.

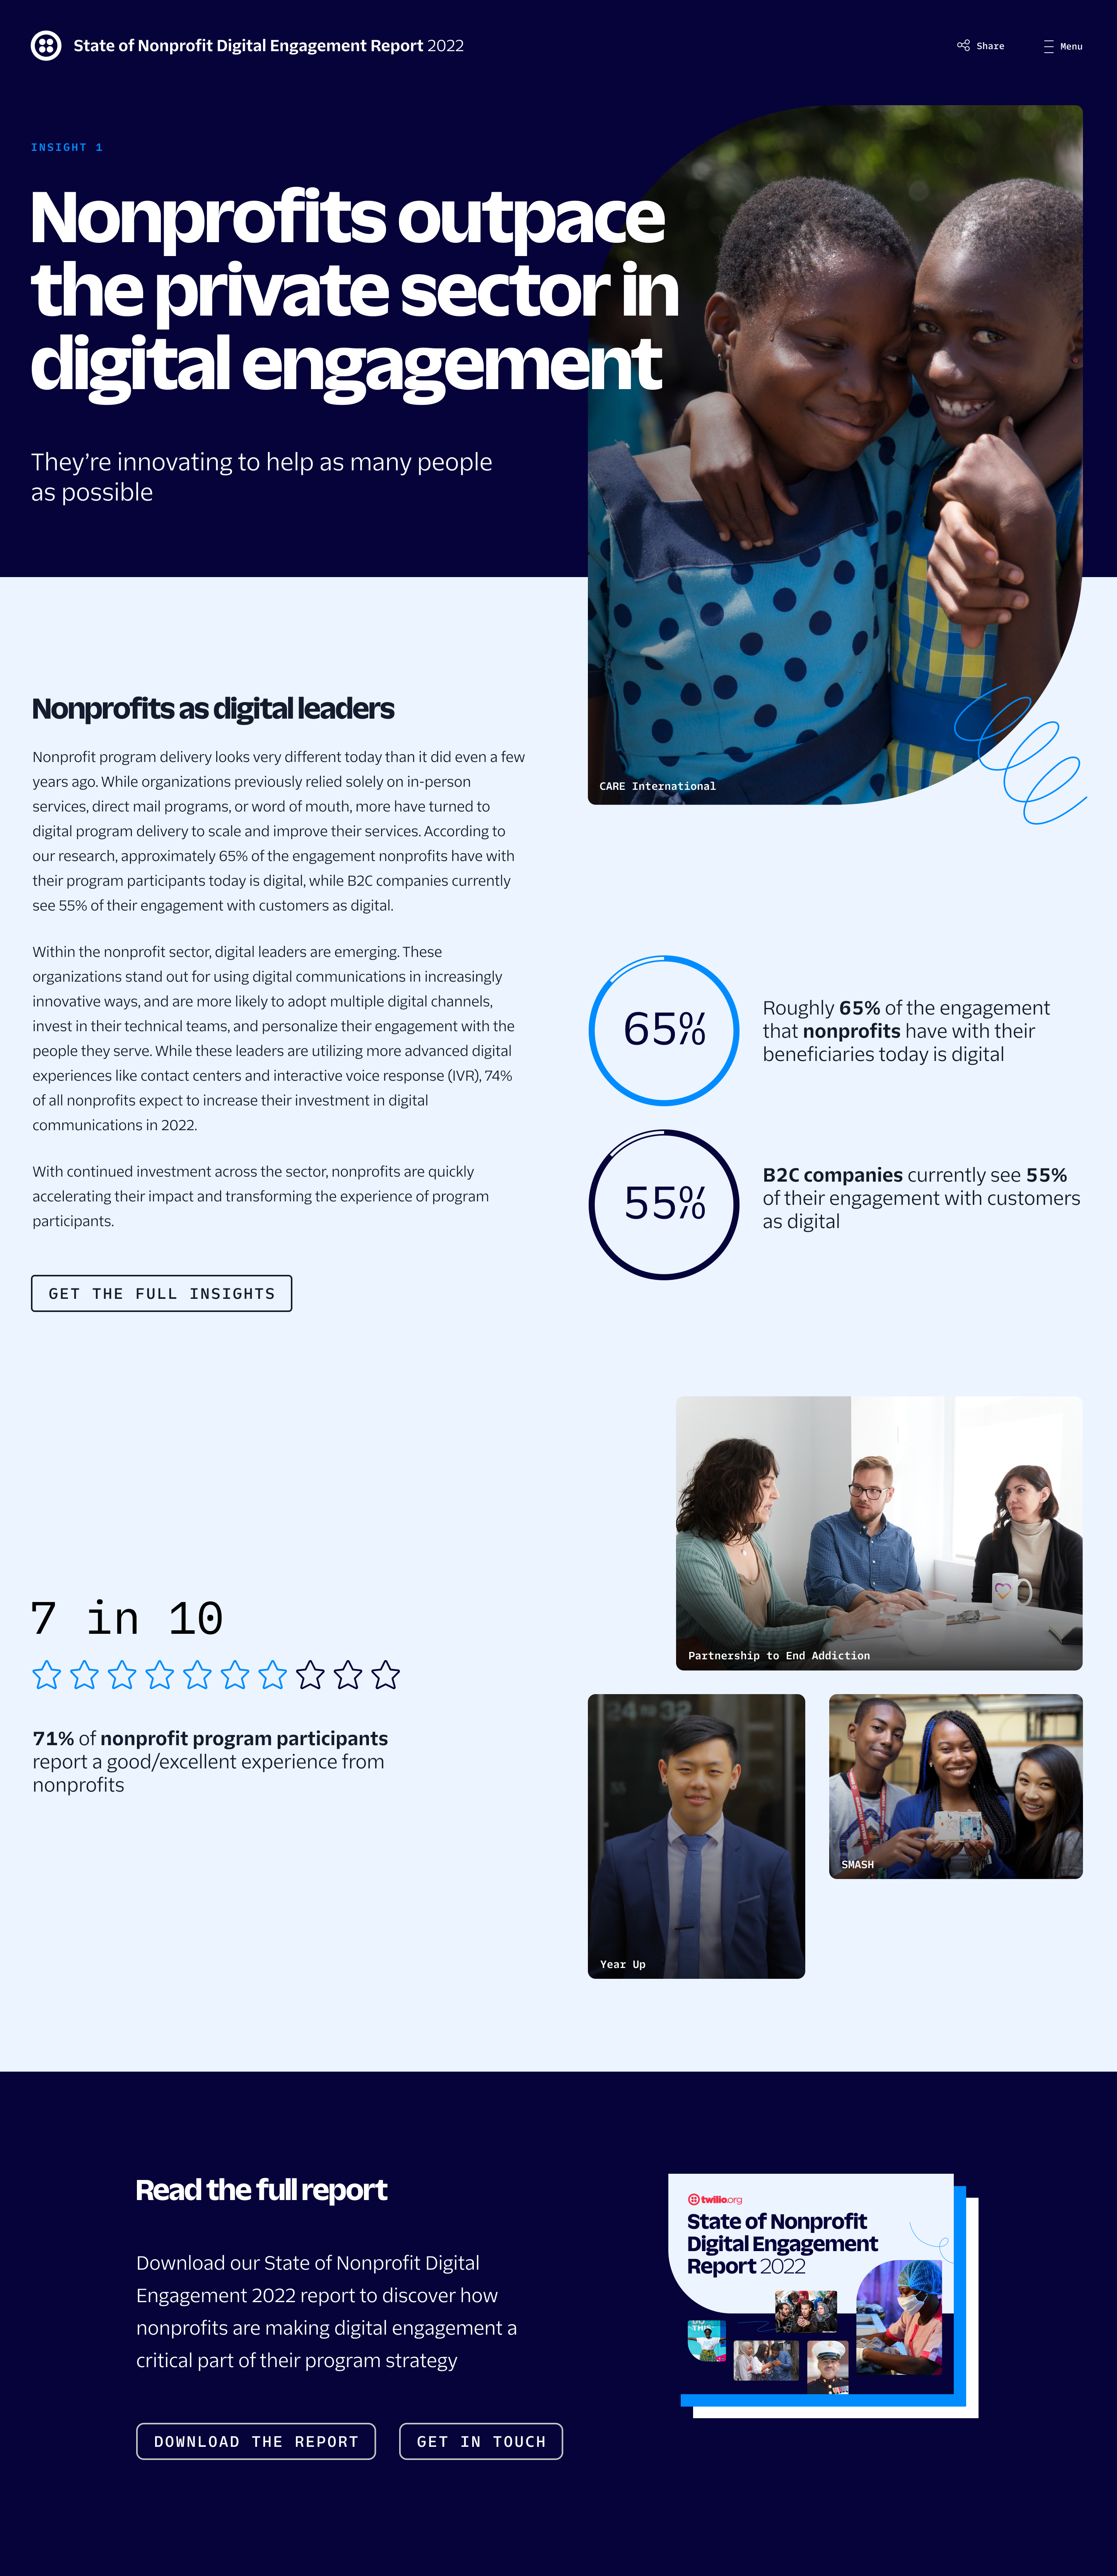
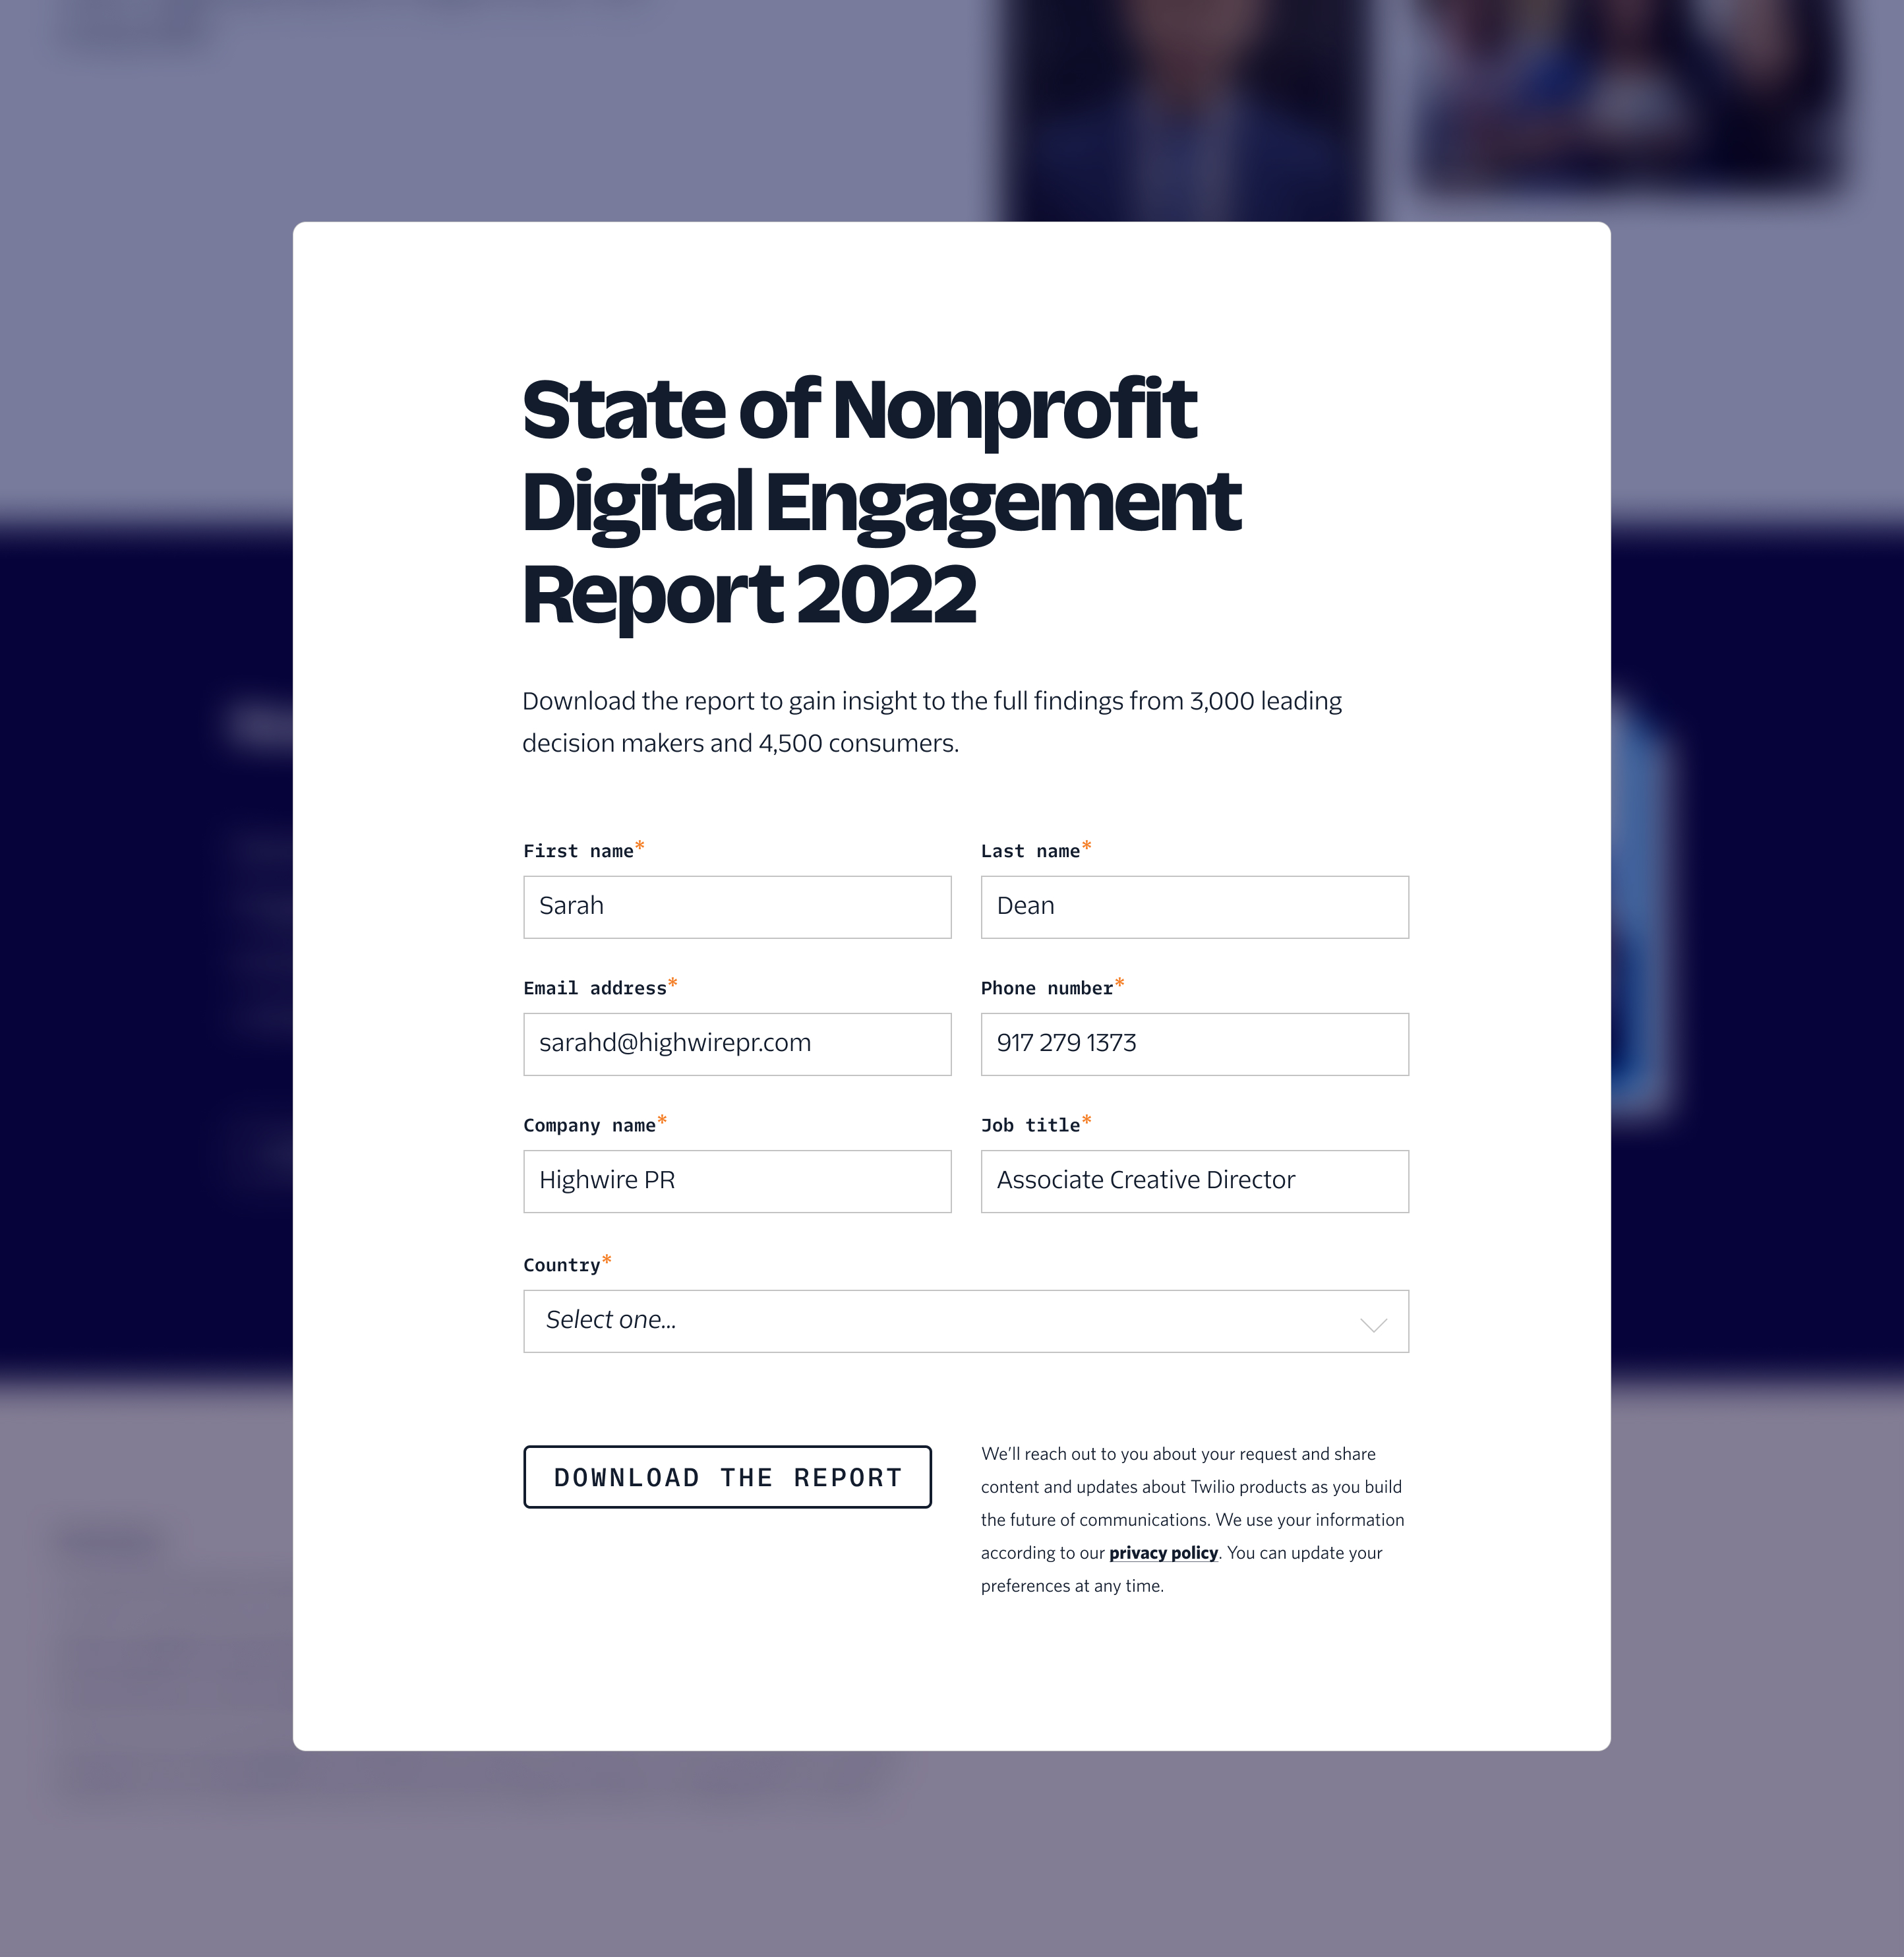
The NPO report web design consists of an introduction section with a prominent download CTA, five subsections featuring two data highlights from each major report topic, and a final report download CTA section. Buttons throughout encourage readers to “Get the full insights” by downloading the full text.
Campaign assets
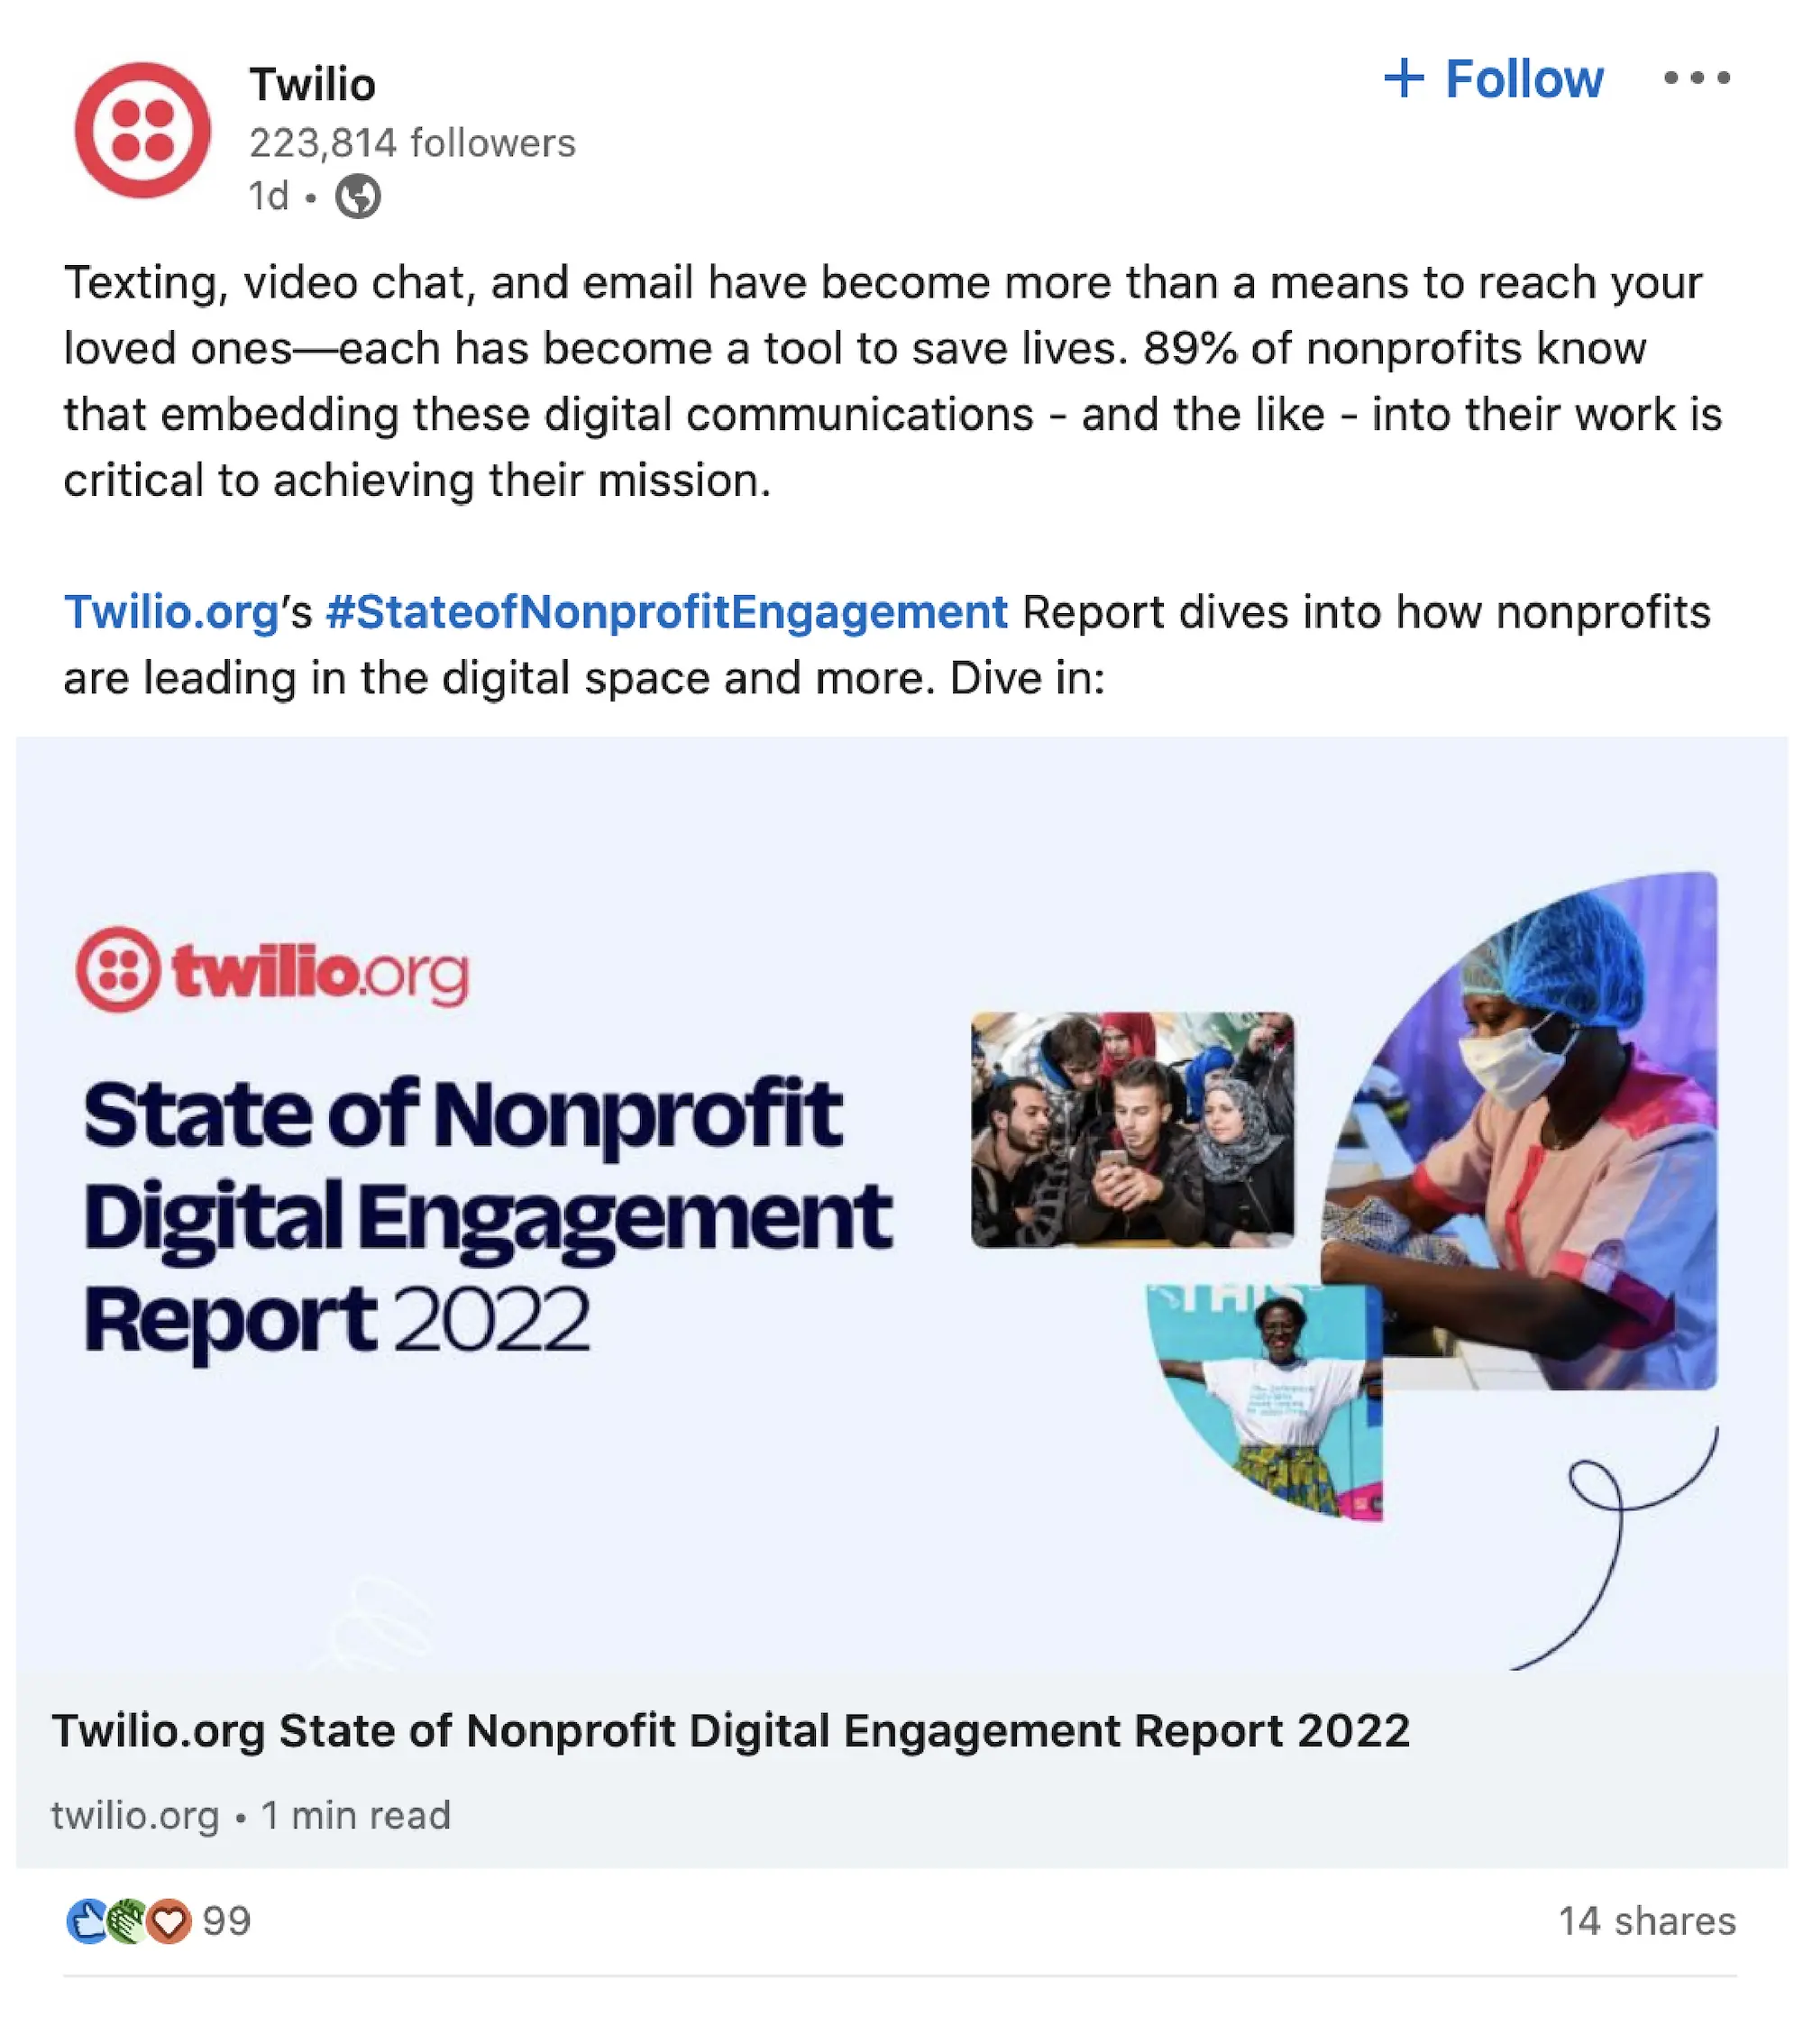
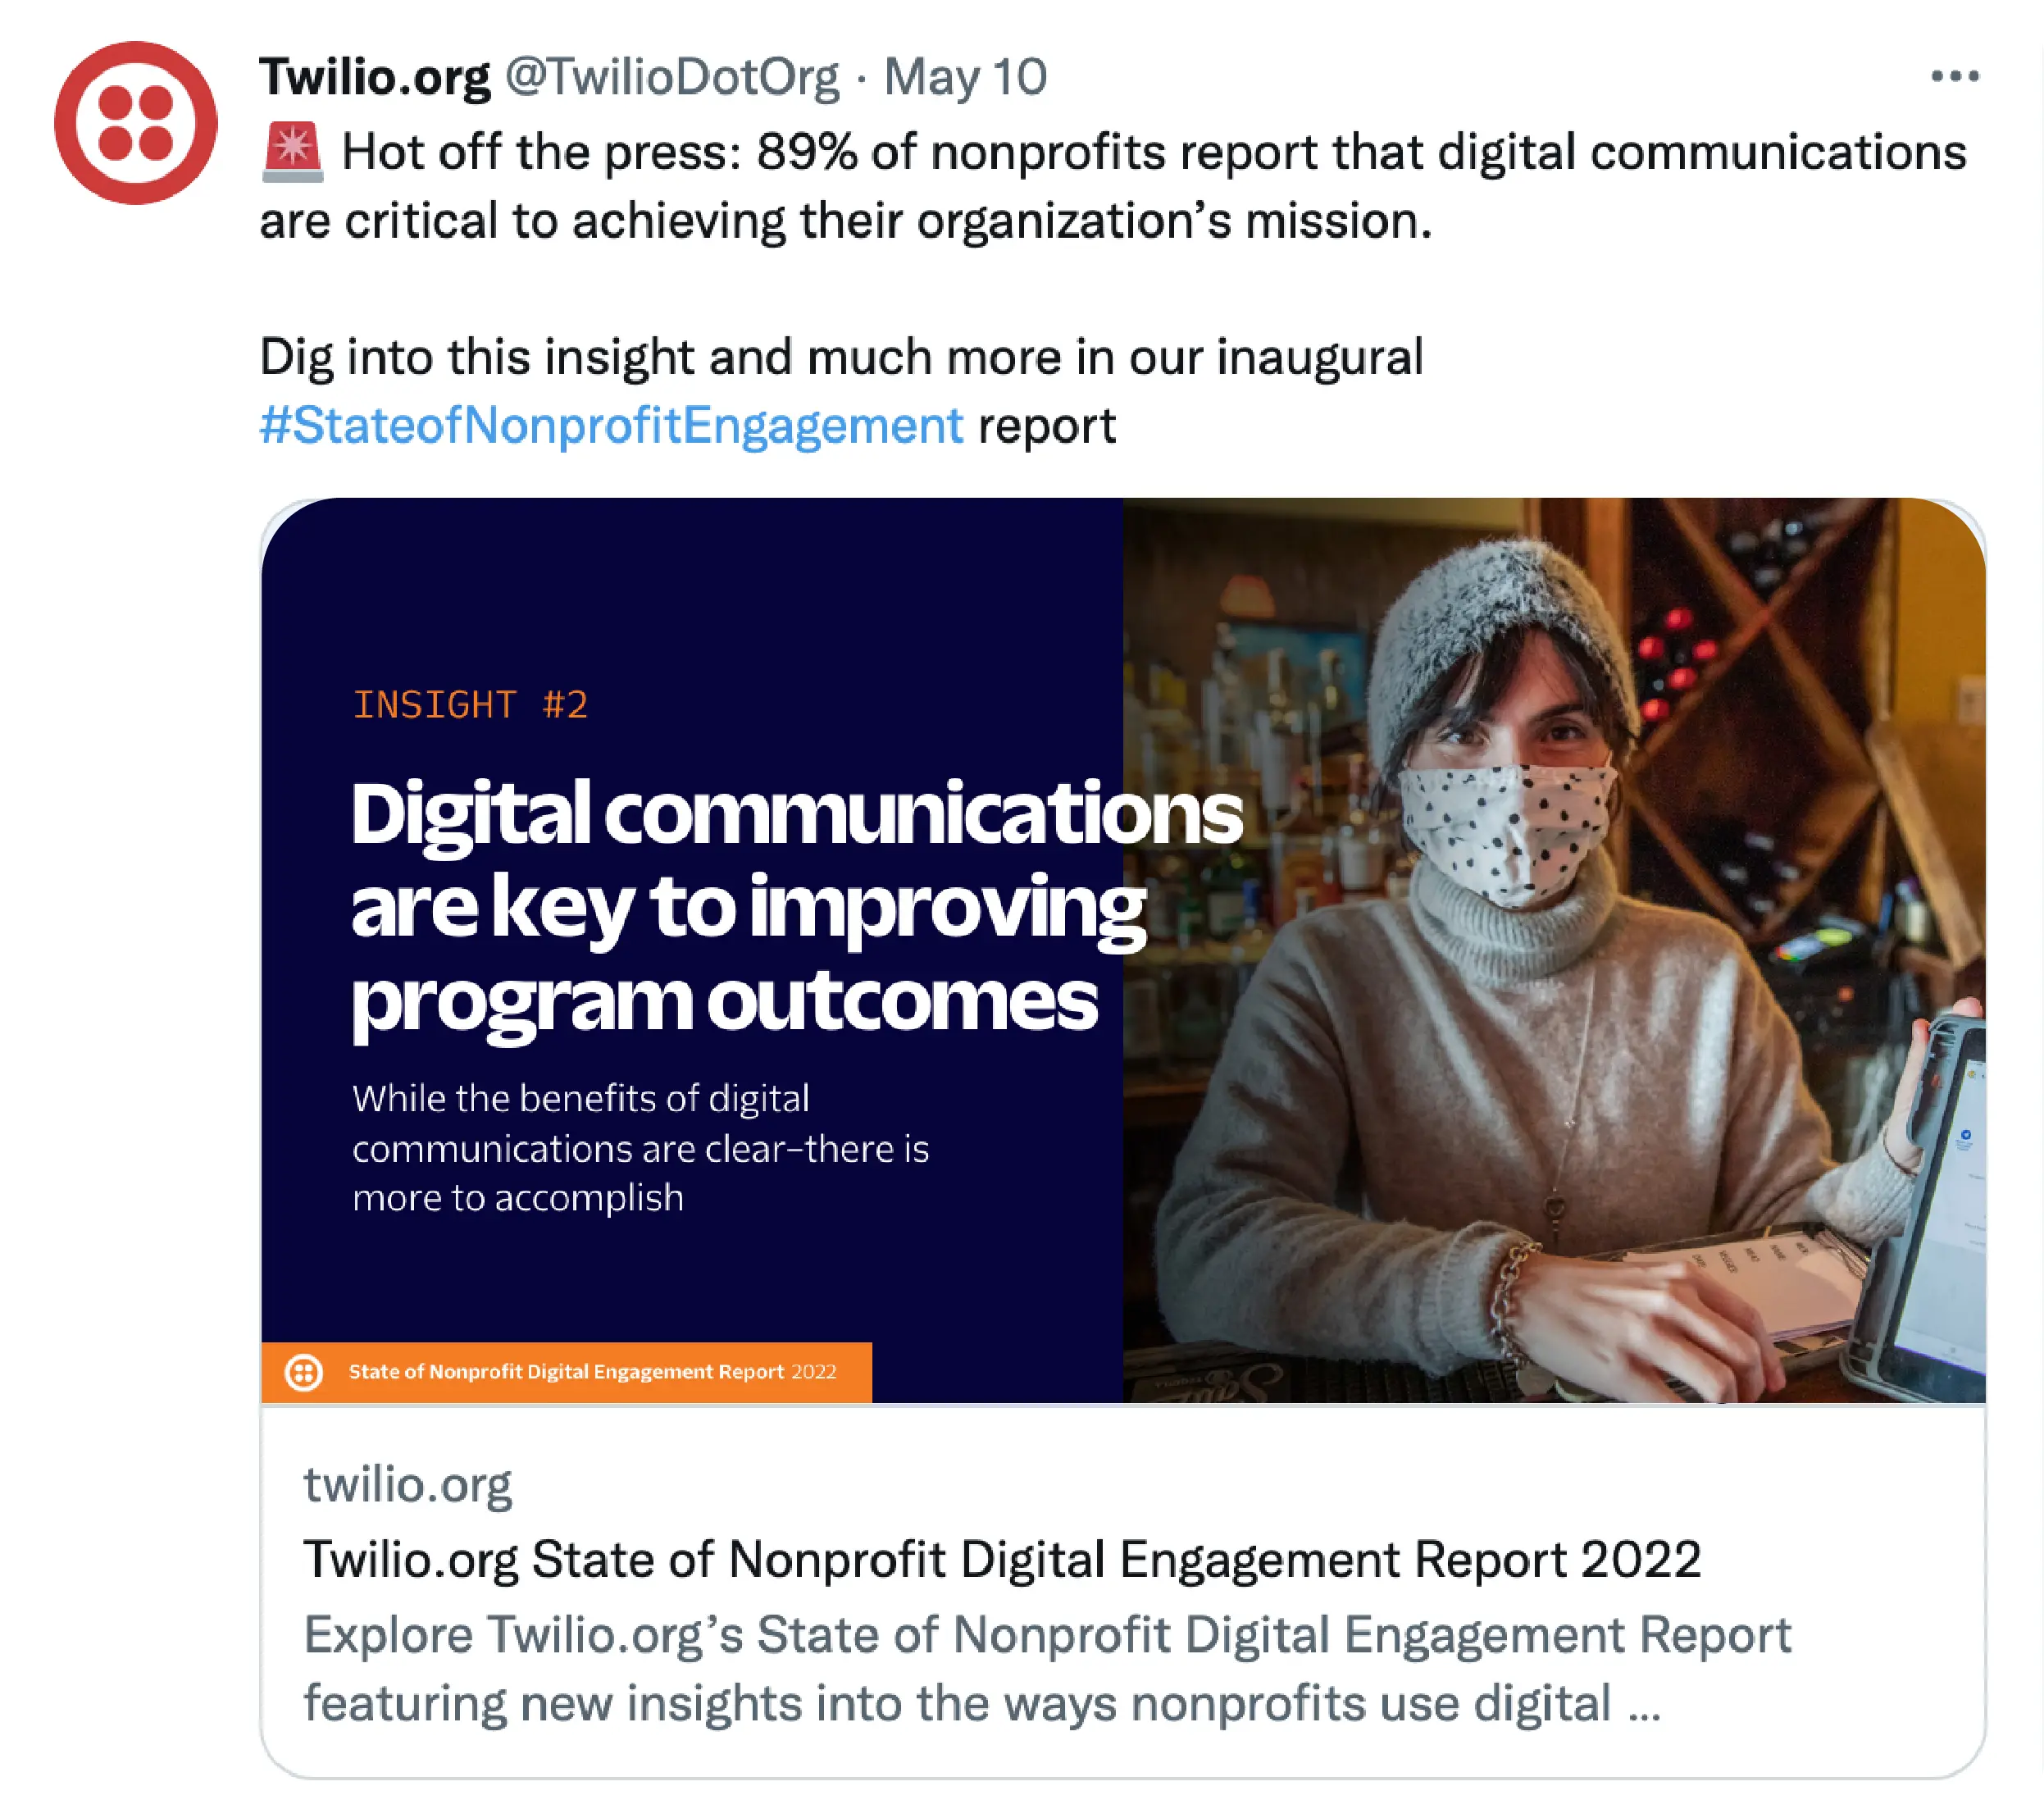
Additional campaign deliverables included an infographic of key takeaways and a suite of social media assets for organic and paid promotion. The examples below show static social cards used to promote the 2022 State of Consumer Experience Report on Twitter and LinkedIn.
Agency: Highwire PR
Client: Twilio
Project/ client lead: Bob Gohn
Design/creative lead: Sarah Dean
Report design support: Marina Brolin
Infographic design: Charlie Jackman
Developer: Dave Morreale
Editorial support: Rob Christie